
Author Archives: Vikram Murarka

Vikram Murarka

About Vikram Murarka

Chief Currency Strategist at KSHITIJ.COM. Likes to look at the markets from many different angles. Weaves many conventional and unconventional technical analysis techniques and fundamental analysis into a global macro perspective. Likes to take the road less traveled.

10 Yr German Bund/TBond Spread

Yield Spreads and Currencies

WHAT IS THE ONE FACTOR TO WATCH FOR IN CURRENCIES?

There seem to be so many variables that impact currencies, so much news and data releases to follow, so much to keep track of, that it is easy to get overwhelmed. The more seasoned people talk about Inflation and Central Bank action. But, even these give little information because they do not change on a daily basis. Inflation data, for instance, is available only on a monthly basis and even then with a lag. So, the question is, what are the main factors that impact currency markets? Is there any one main factor to definitely watch while trading currencies?

We should always take a look at the direction of the Spread between the yield on US Treasury Bonds on the one hand and that on bonds of other countries. These Yield Spreads often have a very high correlation with currencies. Here we look at how these Spreads work for the three major currencies, the Euro, Yen and Pound.
10 Yr German Bund/TBond SpreadFOR EUR-USD

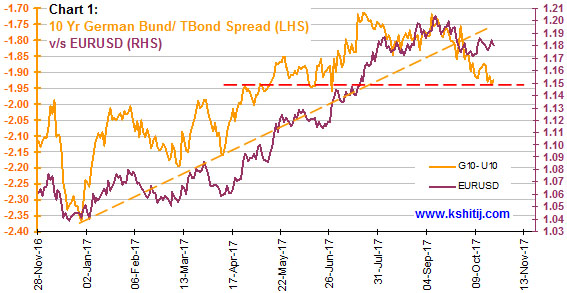
While watching the Euro-Dollar, we should always check the trend in the Yield Spread between the 10Yr German Bunds and 10Yr US T-Bonds (German 10Yr – US 10Yr), plotted on the left hand axis of Chart 1 alongside. This has a strong directional correlation with the Euro-Dollar rate, plotted on the right hand axis.

The Spread has risen from -2.37% (Jan ’17) to -1.72% (6th Sep ’17) as German yields rose faster than US yields in that period. This was accompanied by a rise in the Euro-Dollar from 1.0405 to 1.2035 on a trend basis. The up-down undulations in the Spread along the way have also been mirrored in the Euro-Dollar rate.

Looking ahead, there is a possibility that the uptrend in the German-US Yield Spread since Jan ’17 may have been broken. The earlier uptrend in the Euro-Dollar since Jan ’17 has also stalled along with the fall in the German-US Yield Spread from -1.72% (6th Sep ’17) to -1.93% now.  A break below -1.95% on the Spread would confirm the break of the uptrend. If that happens, the Euro would be vulnerable to a break below 1.17.
10 Yr TBond JGB Spread vs USDJPYFOR USD-JPY

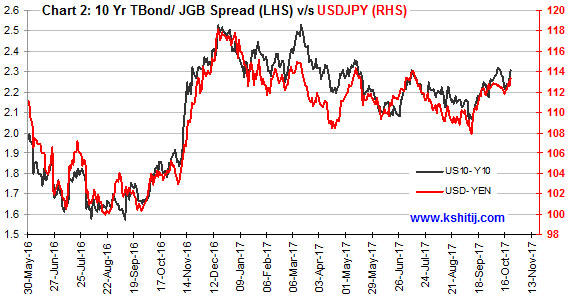
Similarly, there is a strong correlation between the 10Yr US T-Bond / 10Yr JGB Yield Spread (US 10Yr – JGB 10Yr, left hand axis) and Dollar-Yen (right hand axis) on Chart 2 alongside.

There was a sharp rise in the Spread from 1.57% (Sep ’16) to 2.51% (Dec ’16) which was accompanied by a rise in Dollar-Yen from 100.40 to 117.89. The

Spread has been ranging sideways between 2.51% and 2.06% thereafter, with a slight downward bias, which has been reflected in the slow appreciation of the Yen from 117.89 (Dec ’16) to 107.84 (6th Sep ’17). More recently, the Spread has been moving up again to a level of 2.31% now, and Dollar-Yen too has risen to 113.30 along with it.

We have to now see whether the Spread will move up further towards 2.35-2.40% or higher. If so, Dollar-Yen might move up towards 115+.
10 Yr UK Gilts US Bond Spread vs GBPUSDFOR GBP-USD

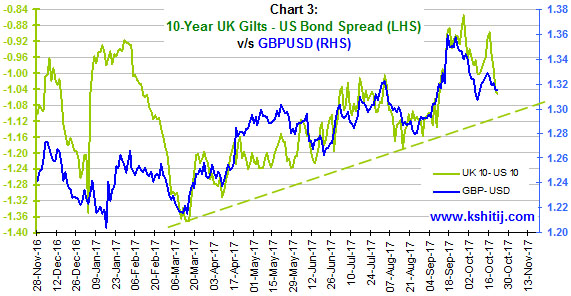
Chart 3 plots the Spread between the 10Yr UK Gilt and 10Yr US T-Bond yields (UK-US) on the left hand axis and the Pound-Dollar rate on the right hand axis.

Here too we see the strong correlation between the Spread and the exchange rate, especially since March 2017, except for a brief period in May.

Going forward, the Spread (currently -1.052%) could come down further towards -1.11%. If so, it could pull the Pound (currently 1.3149) down towards 1.30. Thereafter, if the Spread bounces from the trendline Support near 1.11%, the Pound too might be able to find Support near 1.30.


GOING DEEPER

To go deeper, we can try and study the trends in the individual Yield charts – the US T-Bonds, the German Bunds, the Japanese JGBs and the UK Gilts – and try and see where they are each going separately and then to try and pair the individual studies together to arrive at the Spread direction from a different angle. Also, we can study the correlation between the exchange rates and the Spreads at other points in the yield curve, for instance the correlation between the 2Yr Bund-Bond Spread and the Euro-Dollar. These could give us additional insight into the direction of the Yield Spreads and hence into the direction of the currencies as well.


CONCLUSION

Of course, while the correlation between Yield Spreads and currencies is highly reliable most of the times, there are times when, like everything else, it does not work very well. This is to be expected and allowed for. Further, while it is one of the most important factors to watch, it is not the only one. That again is to be understood in the corrective perspective. All said, however, if there is one single factor that should definitely be tracked to figure out currency movements, it is the Yield Spread between countries.


PS:

You can track our ongoing daily forecasts on Yield Spreads and Currencies in our free Morning Briefing report.

Why does kshitij.com forecast currencies?

Why does kshitij.com forecast currencies?

Why does kshitij.com forecast currencies?A friend sent an interesting inspirational YouTube video link the other day. The speaker in the video encouraged his audience to look inside themselves to see why they do what they do in their work field. What motivates them? It is the motivating factor behind any product or service offering, in fact behind any endeavor, that shapes its colour and character and ends up as a good or bad feeling with the people who use it.

That got me thinking, why does KSHITIJ.COM forecast currencies?

Celebrating the Human Spirit

Before Roger Bannister ran the mile in less than four minutes in 1954, the “4-Minute Mile” was an impossible barrier for humanity to break. Once he smashed the barrier, many others were able to follow. The Tenzing Norgay – Edmund Hillary team scaled the Everest for the first time in 1953, inspiring several others to follow in their footsteps. There are many such stories in every field of human endeavor where people have attempted to do the impossible. And, whether they succeeded or not, they ended up inspiring many. Everyone who attempts to do the impossible is essentially celebrating the human spirit.

Why do we forecast currencies? Primarily to have fun, to rise to the challenge, to prove that it can be done. We are unwilling to accept the notion that currencies cannot be forecasted. We want to stretch the boundaries of the possible.

Attempting the Impossible

Back in 1995, people said, “You cannot use Technicals to forecast the Rupee since it’s not a freely traded market”. We did. Successfully. Today we have used the same techniques to forecast thinly traded, tightly controlled exotics like the Egyptian Pound, Myanmar Kyat and Vietnamese Dong, with relatively high degrees of success.

Then people said, “You cannot forecast currencies. At least not for the long term”. We consciously worked to lengthen the horizon of our forecasts, from one week to one month to three months to the twelve months that we routinely forecast now. And we would like to target the 18-month and 24-month time frames next.

Our name, KSHITIJ, means horizon, a never to be reached destination, but a goal that inspires us to keep moving forward. In the process we have undertaken many remarkable journeys in currency forecasting, evolved several new forecasting techniques and made our forecasts better for our Clients.

Forecasting in the Third Dimension

It is the same spirit of having fun while trying to attempt the impossible that is prompting us to hone our capabilities in forecasting in the “third dimension”. Most forecasters answer only the very basic question, “Where is the market going to go? Up, down or sideways?” This is the first dimension of forecasting. Then, of course, they quickly graduate to predicting the price targets, to answer the second question, “To what level?” This is the second dimension.

Unfortunately, this is where most people tend to stop. Very few people ever make any attempt to answer the question “By when? How long will it take?” This is the third dimension of forecasting, where we have been working for the last 2-3 years, with increasing degrees of success.

After this, we will train our sights on the fourth dimension, the fourth question, which people do not even currently articulate. That is, “What is the path the market will take to reach where you are saying it will reach in your stated time frame?”

Maybe we’ll be able to do it, maybe we won’t. But we’ll surely try. And have fun doing it.

The fun is also in the improvement

The spirit of celebrating the human spirit goads us to not only cross new horizons but also to continuously improve upon the quality of our forecasts. We started tracking the performance of our Dollar-Rupee forecasts in April 2006. Incidentally, we find that we are the only forecasting service in India that publishes its track record on the web for public scrutiny. We keep wondering, how can improve if you do not track your performance?

For instance, back in October 2008, our reliability (a combination of directional accuracy on the one hand and deviation from actual on the other) stood at barely 41.9%. This was simply unacceptable. Obviously we had to do whatever it takes to improve. And we did. The good news is that our current reliability now stands at a much more satisfying and profitable 72%.

72% ReliabilitySee our forecast reliability at http://72pct.com

Our effort is to increase this reliability to 80%. That is when magic will truly happen. Maybe it is an impossible horizon to chase. But again, it’s fun to try the impossible.

Our fun helps our Clients

While our core motivation in forecasting currencies is to celebrate the human spirit, we also want our forecasts to serve our Clients well. The more reliable our forecasts become, the longer the time frame we cover, the lesser the deviation from the actual, the more closely we are able to map the path to the future, the more useful our forecasts are to our Clients.

The biggest contribution our forecasts make is that they help reduce the fear of foreign exchange in the minds of our Clients and encourages them to undertake systematic forex risk management with greater confidence. To be able to impart a sense of confidence in our Clients is an even bigger motivation than only having fun.

And it is this Spirit of Service, the feeling of exhilaration in having helped our clients achieve their goals, and to form new benchmarks in the arena of currency forecasting, that is our driving force.

When you use our forecasts, you will experience the celebration of the human spirit in the uniqueness, boldness and reliability of our forecasts.

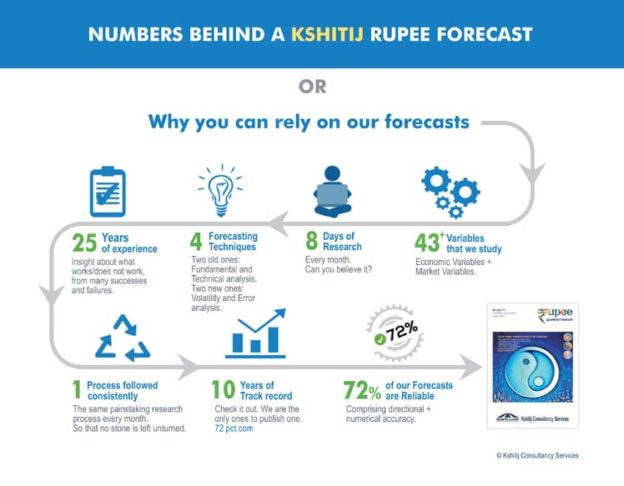
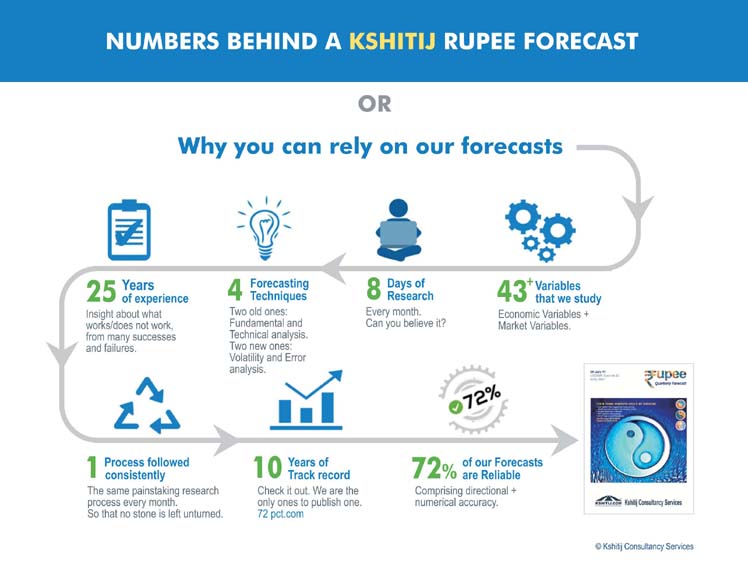
Numbers behind a Kshitij Rupee Forecast

A few words on the KSHITIJ Forecasting Process

Forecasts? Everyone needs one.

 “Nobody can forecast currencies” is an oft heard statement.  This is a popular perception, perpetuated by academic literature of the time as well as statements from people in positions of power and responsibility.

Isn’t it strange, therefore, that everybody in the currency market wants to know where different currencies will go, whether they will strengthen or weaken? The simple fact is that it is a basic human need, even an essential business need, to want to know what the future holds.

Forecasts are needed by everybody, everywhere, not only in the currency markets. Everyone makes forecasts about everything and everyone wants to know the forecast about everything. Without forecasts, the business world and the financial markets would come to a stop. In the financial markets, traders closely track the forecasts made by the central banks, the forecasts or “guidance” made by companies and the forecasts made by the financial institutions on the quarterly results of the companies. Market prices react strongly when these “expectations”,  which are nothing other than forecasts, are missed.

In the business world, the entire annual and quarterly budgeting process is an exercise in forecasting, without which it would be difficult to conduct operations efficiently. While budgeting, the businesses want to have an idea of what the demand scenario is going to be like, what will be the state of the economy, what will be the levels of interest rates and exchange rates in the next quarter, 2 quarters away, 1 year away or even 3 years away, how will commodity prices move? Forecasts are needed for all of these.

Where do we come in? We take on the “impossible” task of trying to forecast the currency markets and then even go further to take care of our Clients’ foreign exchange risks with the goal of reducing volatility and saving money for the Clients.


What makes our forecast valuable for our clients?

Our philosophy and approach to forecasting is what makes our forecast valuable to clients.

Synthesis is the cornerstone of our forecasting philosophy, in essence drawing strength from the “many”.  There are many factors affecting a financial instrument in this intricately connected global financial market.  We check all the factors that we know of closely and select the most pertinent ones. Nothing is unimportant unless it is proved worthless. Every month, we study some 50+ variables very systematically as part of our research process while making our monthly Dollar-Rupee forecasts.

Numbers behind a Kshitij Rupee Forecast

We also synthesize many techniques within Technical Analysis – classical charting, trendlines, moving averages and Elliot Waves – while forecasting. In fact, we also synthesize three supposedly diverse techniques – Fundamental, Technical and Statistical analysis – to try and arrive at a more holistic forecast.

Our endeavour is to try and study the underlying ocean currents, so that we may better understand the waves on the surface.  Most of the times, the underlying forces that drive the markets remain out of sight. To identify those forces and understand their implications is our primary target. In order to be able to do that, we not only study market variables themselves, but we also do a lot of inter-market and ratio analysis, correlation studies and regression studies.

Interestingly, we have also recently started studying the pattern of our own past errors to see if they can give us advance warnings of unanticipated market movements.

In short, we try and leave no stone unturned while trying to arrive at our forecasts.


Trying to minimize surprises

To think of it, why do forecasts tend to go wrong? A gross beginner’s forecasts tend to go wrong simply because he is new to the craft. Later on, a forecaster with 2-5 years of experience might go wrong because he might not have exercised the required due diligence. Even after rising further in experience, a more seasoned forecaster might end up making mistakes if he happens to succumb to his biases. It is to control all these factors that the need for more rigorous analysis starts being felt. And in fact, if these are dealt with there is a good chance that the forecaster may start to achieve reliability in the 55-57% region, maybe even in the 60-62% region.

Therefore, if all these factors are taken care of, a forecast would go wrong only if surprises happen to hit the market. So, to increase reliability levels to 70% and beyond that to 75-80%, the effort has to be to try and be as informed as possible, so as to minimize the chances of being surprised. In effect, this is the same as taking a look at as many factors as you can, in as many ways as you can, so that you leave no stone unturned.

In other words, a wide ranging study of variables and an approach of synthesis (as opposed to reliance on any one or two methods of analysis) is merely an enlightened survival technique.


Going into the next level

Thinking ahead, perhaps the way to pull forecast reliability above the 75-80% threshold would be to actively study the times when we have gone wrong, when we have been surprised, and to study the instances when correlations, that are normally seen to work in the market, happen to fail.

We intend to start working on these. There will surely be hurdles to cross, mistakes to be made, frustrations to be endured. However, at the end of it, hopefully we will be able to move our forecasting reliability to the next higher level.

Inshallah.

Featured Video Play Icon

How Systematic Hedging paid off for Importers in Aug’2018

August 2018 has been a trying time for Importers because Rupee has depreciated to its weakest ever level of 70.39. In this video we show how our Reliable long-term Dollar-Rupee forecasts and systematic hedging over the past 12 months have helped save Rs 1.54 per Dollar.

This saving could have been possible only when there is a combination of

  1. A pre-sanctioned Hedging Cost Budget, which makes it possible for the Risk Manager to pay Forward Premium
  2. Reliable forecasts that help to decide to hedge and pay the Forward Premium

If you want us to help you with forex risk management, please feel free to write to us as info@kshitij.com

Thank you.

Featured Video Play Icon

Size Matters. Perhaps more than price.

Yes, it is true. Like in all other important aspects of life, in forex hedging also, size indeed matters.

Remember that old formula, R = p.q, or Revenue (or Outgo) = Price x Quantity?

Size Matters

The successful businessman keeps an eye on both variables, whether he is selling or buying. Depending on the nature of price movements in the market he is operating in, monitoring the quantity becomes less or more important. If the price tends to be fixed, then the only thing to do to maximise revenue is to try and maximise the quantity.

However, if there is a fairly large degree of variability in the prices, then it becomes very important to judiciously increase/ decrease the quantity transacted at each different price with the aim of maximizing the sale revenue or minimising the purchase outgo.

The same simple concept applies to successful forex hedging as well, except that most of the time our attention is so fixated on the Price (rate) only, that we tend to totally forget the importance of the Quantity (amount) part of the equation. Picture the professional card player. He keeps varying the amounts that he bets.

Here, we remind that one of the most fundamental tenets of successful hedging is that we should never hedge 0% (be totally open) nor should we ever hedge 100% (be totally covered) and that we should always hedge in parts.

When we do that, we equip ourselves with a variable (Amount) that we have greater control on that the Rate. If the rate is not very attractive but we are compelled to hedge, we can look to reduce the amount. If the rate is good, we can increase the hedge amount.

Further while the difference between two hedged rates tends to vary by 1-5%, the amount that is hedged tends to be in the region of 8-20% of the exposure amount and should therefore actually have a greater weightage in the R = p.q. formula.

Taking another analogy, while driving, all of us regularly use the accelerator also (apart from the brake) to reduce speed, perhaps more often than the brake. Imagine what would happen if we were to use only the brake whenever we needed to slow down! Similarly, in hedging also, we have to make effective use of the lever of the Amount apart from that of the Rate.

As we said, Size Matters!