Author Archives: Vikram Murarka

About Vikram Murarka

Chief Currency Strategist at KSHITIJ.COM. Likes to look at the markets from many different angles. Weaves many conventional and unconventional technical analysis techniques and fundamental analysis into a global macro perspective. Likes to take the road less traveled.

eurusd-daily-amplitude

Amplitude Probability Distribution for Currencies

It is important to know the characteristics of any market that we trade. This helps us approach the market with more awareness and reduces the element of surprise. It also helps us formulate our trading strategies.

In the following pages we try to answer the question, “How much do currencies move over various time frames”. We have examined price data for EUR-USD, USD-JPY and USD-CHF for the last 3 years to see what is the Amplitude (difference between the High and Low) for these currencies over 1, 3 and 5 day time frames.

We believe that this might be helpful in 1) enabling us to choose a suitable Time Frame for our trading activity and 2) forming an idea of how much profit/ loss might be reasonably expected in our chosen time frames.

Put into other words, this is also an examination of the Volatility of the subject currencies in various time frames.

Please click on
EUR-USD
USD-JPY
USD-CHF


EURUSD Amplitude

EURUSD Amplitude

USDJPY Amplitude

USDJPY Amplitude

USDCHF Amplitude

USDCHF Amplitude
Flags and Pennants

Series on Trading Chart Patterns – Part 1 – Trading Flags and Pennants; Long Term Trend Resistance in Sterling

A few words …. We used to bring out “The Colour of Money” as a weekly forecast of the currency markets some years ago and it used to be well appreciated by a few connoisseurs. However, we discontinued the service in March-2001 because not many people wanted to pay for weekly views and the intellectual drain of having to “drum up” a forecast within a weekly deadline was getting to be a bit much.

We are now reviving “The Colour of Money” as an initially free publication as a means of communicating with you, Dear Reader, and offering what comes to mind, hopefully of value. The emphasis right now is on serendipity and we are not going to be bound by a weekly or fortnightly deadline. That said, the effort would be to bring out a couple of issues a month. We hope you will look forward to seeing “The Colour of Money” in your mailbox in the coming weeks-months-years. But, if you would rather not have us waste your time or your mailbox space, please do let write back and we shall unsubscribe you. Thank you!

In this Issue

  • Series on Trading Chart Patterns – Part 1 – Trading Flags and Pennants
  • Long Term Trend Resistance in Sterling

Series on Chart Patterns

Part I – Flags and Pennants

Bull Pennant in USD-JPYWe start off with a series on some of the familiar chart patterns (knowledge of the patterns is assumed), trying to share our real-life trading experiences. Here goes:

Bull Pennant that worked 
Flags and Pennants are Continuation Patterns in a trending market. They can be used for initiating new positions in the direction of the Trend or adding to existing positions.

Look at the Bull Pennant in USD-JPY in the last week of Feb-04, in 4-hour chart alongside. The USD had risen vertically from near 105.50, forming the “Flagpole”. Thereafter the market consolidated between 109.40 and 108.00 for 3 days bounded by the Horizontal Support near 108 and a declining Resistance (both shown in Red). The Price converged near 108.05 between these two lines and then broke upwards, out of the Pennant to rise to 109.80. A classic Pennant!

To Trade the Pennant
By the 23rd and 24th of Feb, it was clear that a Pennant was forming, since the Bottoms were forming a horizontal Support and the Tops were declining. Once known, the strategy was to take a Long position once the expected upward breakout started,say near 108.25. This was a Stop Loss Long Entry and the order was filled by mid-day on 25-Feb-04, Wednesday. The market rose more than 100 points after that, although the ideal profit target was in the 110+ region. Still, there was ample opportunity to take profit on the trade.

The best thing about trading Pennants (or Flags) is that they give you almost instantaneous profit, if they work. They second best thing about these patterns is that they are rarely ambiguous. You can know when and if they have NOT worked. As such, you can usually set a Stop Loss without fear of getting unnecessarily whipsawed.

For instance, the Stop Loss in the Trade above could have been set at 107.75. If triggered, it would have proven the Pennant incorrect. Also, the Risk: Reward Ratio was very favourable, at 50:100.

Bull Flag ExampleFlag that did not work
On the chart alongside, now, we have an example of a Bull Flag that did not work out. The EUR-JPY had been trending up through Nov-Dec 2001, forming the Flagpole of a potential Bull Flag that formed through Jan-Feb 2002. There SHOULD have been a huge upmove, had the Flag worked, but it did not. The market broke on the downside 07-Mar-02, falling to a low of 111.28 The important thing is that Long positions could have bailed out below 114, say near 113.75 or 113.50, meaning to say that both Flags and Pennants can be effectively traded with manageable and usually reliable Risk: Reward profiles.

Long Term Trend Resistance in Sterling

GBPUSD MonthlyThe Sterling has had an uninterrupted, almost exponential rise from 1.5608 (03-Sep-03) to 1.9142 (18-Feb-04). It has outperformed the Euro over the last few months driven by higher interest rates. A spectacular run, no doubt.

However, as can be seen in the chart alongside, it has run into a strong multi-year Trend Resistance, coming down from 1972, roughly the time the major currencies started to float. Save for the period Jan-93 (after the epic Soros-BOE battle) to Jan-99 (when the Euro was introduced), during which it moved sideways in a narrow range, the Sterling has been following an overall downtrend, albeit with large price swings.

In the present times, although a large section of the market remains Dollar-bearish over a 12 month time frame, the question is, do we have enough justification for a credible break of the extant long-term downtrend in the Sterling?

GBPJPY MonthlyOur caution is buttressed by looking at the long-term GBPJPY chart (shown alongside), where we again see a strong Trend Resistance near the current market level of 207.45. Agreed, we have a sideways trading Wedge on the GBPJPY Cross chart and a breakout will eventually take place, but there may still be at least a couple of months before that happens – unless there is a huge upsurge in USDJPY.

Even in such an event (upsurge in USDJPY), we will not have a clearly bullish upmove in GBPUSD. And, if one of the leaders of the Dollar selloff since Sep-03 begin to tire, it would be good to be cautious on more USD Short positions.

Case of a Swiss Franc Loan

Issues in Corporate Risk Management – The need to define proper objectives

A few words…This is the second issue of “The Colour of Money” after its revival. Many of our old Readers have written to say they are glad to receive this publication again. We thank them for their generosity. And we are glad to publish “The Colour of Money” because it gives us the scope to put to paper serendipitous thoughts that do not otherwise find room for expression in the daily hurly-burly of the market. Please feel free to circulate this e-mag among your friends if it strikes a chord within you somewhere.

In the last issue we had started a series on Chart Patterns, which we will continue in the next issue. In the current issue we are starting another series on Corporate FX Risk Management.

In this Issue

  • Series on Issues in Corporate Risk Management – Part 1 – Focus on Objective


ISSUES IN CORPORATE RISK MANAGEMENT
The need to define proper Objectives

This is an issue not usually dwelt upon in market literature or forums and chat rooms, but success in Corporate FX Risk Management, or even speculative trading for that matter, often hinges upon

  • Defining your objective(s)
  • Devising a plan or strategy to achieve the objective(s)
  • Executing the strategy and
  • Very importantly, remaining focused on the objective

Devising of a plan/ strategy and execution thereof are matters of expertise in market reading and dealing and are usually the more enchanting part of Risk Management or Trading. Rarely is adequate attention paid to the need to define proper Objectives for the risk management exercise. Even if the objectives have been properly defined, they are often forgotten in the heat of market activity. This leads to failure or underperformance in the big picture. We shall try and illustrate this through some case studies in the context of Corporate FX Risk Management.

Case of a swiss franc loanThe Case of a Swiss Franc Loan
A company with a Rupee Balance Sheet (take it as a USD Balance Sheet, if you please), contracts a Swiss Franc Loan at a USDCHF rate near 1.25 towards the end of 1996, after which the Swiss Franc weakens to 1.45 by early 1997 and then trades in a range of 1.45-1.55 through the greater part of 1997-1998. It strengthens to about 1.35 by end of 1998.

The company accounts for the Loan in its books at 1.50 and wants to “earn back” the “loss between 1.50 and 1.35” through “Hedging Operations” which call upon it to sell USDCHF in the Forward Market and earn Cash Profits on such Hedges, which will be booked in its Profit and Loss accounts. Note, thatthe focus is on CASH Profits/ Losses generated through “Hedges” and not on the VALUE of the Loan, which is a Balance Sheet item.

The company starts its “Hedging Operations” near the epochal birth of the Euro.

As we all remember, 1999 was the year in which the Euro was born near 1.17against the Dollar and caused much anguish in the market by weakening throughout the year to end just above Parity. In the process it dragged the Swiss Franc down against the Dollar.

The company, to its dismay, found itself making Cash Losses on its “Sell USDCHF” hedges. To make up the initial losses, it sold more USDCHF in ever increasing larger amounts right through the year, trying to earn Cash Profits on interim bouts of Dollar weakness against the Swiss Franc. Huge Sell USDCHF trades were daily entered into for making a few pips profits, not realizing that the trades were all against the larger Trend.

Its focus on the Cash Profit/ Loss made the company overlook the fact that the ongoing weakness in the Swiss Franc was decreasing the value of the Loan on its Balance Sheet.

In an attempt to first earn “hedging profits” and then to cover losses against the trend, it ended up with a USD 1 million loss, negating, to a large extent, the real Valuation Gain on its Balance Sheet.Had its focus been on the Balance Sheet, the company would have stopped its “Hedging Operations” after the first few hedges made Cash Losses and proved that the market was actually reducing the value of its primary Loan exposure!

Sounds incredible? The moral of the story is that a lot of thought and deliberation should go into deciding upon correct objectives before commencing market operations.  In a subsequent issue we shall take up the case of a company, which started out with the correct objectives, but lost its focus and underperformed as a result.

GBPUSD Weekly Close

followup-in-sterling

Gbpusd weekly close

FOLLOW UP – Bear SHS in Sterling?

In the last issue we had pointed out a three decade old Downtrend Resistance on the GBPUSD Monthly chart, which presaged weakness in GBPUSD. Technical Analysis is based on the assumption that ALL factors governing Price are in the Price itself and we can predict Price movements through the study of Charts. This assumption seems to be proving correct yet again. The Sterling seems to be developing a Bearish Shoulder Head on the Weekly chart (shown alongside), confirming the prognosis of the monthly chart.

If this works, Cable can fall to 1.73-1.70 over the next 4-8 weeks Negation would need a Week Close above 1.8589, as compared to the current level of 1.8158.

A tale of two e-mails

A Tale of Two E-mails

A tale of two e-mails

A Tale of Two E-mails…..As many of you know, we provide a twice-daily trade recommendation service called “FX Thoughts of the Day“. We are one of the several such services on the Internet and cannot claim any special superiority for ourselves. The one thing we do try and provide at all times is honesty.

A couple of weeks ago we received the following e-mails. One gentleman had lost 75% of his account trading our recommendations, while another had made 25%. We ourselves had lost 2% of our account. Our trade recommendations being the same, what accounted for the wide difference in results achieved?


The Angry E-mail

What is this for a service !!!!!!!!!!

If I followed your trading advices for the last 10 days I lost 3/4 of my account!!!!!!

It is always the same, or your adviced entry is never touched (so a so called winning trade could never happen) and when touched, it was always stopped out.

And for such a service YOU DARE TO ASK MONEY FOR !!!!!!!!!


The Satisfied E-mail

Tiz sad to see so many losing. I have gained about 25% this week alone, using both your information and also using other guides. What brings the losses to mind is that people are not researching the market before investing. With the information you provide, plus studying the charts, financial news, etc, can’t see why there is so much loss.

Reminds me of when I started this FX. Cold and green, I lost 50% of my account in ONE DAY, doing nothing but following information others provided without knowing what to do in the proper way.

Those who lose do so through not knowing what to do. Keep sending me the information please. It is a vital tool in helping me to continue to grow in understanding the financial markets. 


The Trader who lost 75% was obviously very highly leveraged.
 Should he have been? In this issue of “The Colour of Money” we take up some issues that are seldom touched upon in the usual discussions on Forex trading. Certainly, we wish somebody had told us about these earlier – we would have lost lesser money and might have started making money faster.

In this Issue

  • Hype, myths and misconceptions in the Retail FX market
  • Contours and Parameters of the FX market
  • Survival Tips. May lead to eventual success


HYPE, MYTHS and MISCONCEPTIONS

Hype:-

I/ we/ he/ she made 200%!
The reality, according to Parker FX Indexes, is that professional forex managers as a whole have lost 2.99% over the last 12 months and have made only 6.44% over the last 36 months on an UNLEVERAGED basis. The reality, also, is that most professional forex money managers employ very conservative Leverages of only about 5-10 times. Why? Because the lower the Leverage, the lower the Risk. The higher the leverage, the higher the risk.

So, the next time you look at someone’s stupendously high Returns, the immediate question to ask is “What is your Leverage level?” That gives you an idea of the level of Risk the Trader carries. A high leverage magnifies Profits, no doubt, but it also magnifies Losses. That’s the reason our Reader lost 75% of his account while we lost only 2%.


Myth:-

Trading FX for a living is easy/ Is the way to get rich quick
That is what most trading platforms/ brokerages would want a newcomer to believe, where ridiculously high leverages are touted as the keys to trading heaven. The other day we saw a brokerage offering 400:1 leverage on a Mini account! If things were so easy, why don’t you see several more millionaires on Internet FX Forums?

The reality is that, like every other business (please remember that Forex Trading is as much a business like any other business), success comes over the long haul. In the beginning you start by losing money. Then you learn how not to lose money. Then you learn how to make money. After that you can start thinking about how to make big money. You have to have the patience, willingness and the requisite capital to stay the course. Obviously, shunning high leverage is the first thing to do while you are learning the ropes

You might want to read “The Evolution of a Trader” on our website in this regard.


Misconceptions:-

here are several misconceptions in the FX marketplace. We’ll take up just two examples:

Indicators, indicators, indicators!
Many believe that knowing all the indicators offered with the normal charting software is the way to become a successful Trader. The fact is, Indicators are merely TOOLs to help us in devising a trading plan/ method. They are certainly not a substitute for the discipline and skill needed to execute the trading plan. Most professional traders/ investors usually employ just one or two indicators and that too of the simplest kind. Most of them adhere to the KISS (Keep it Simple, Stupid) principle.

Trading is the same as Investing
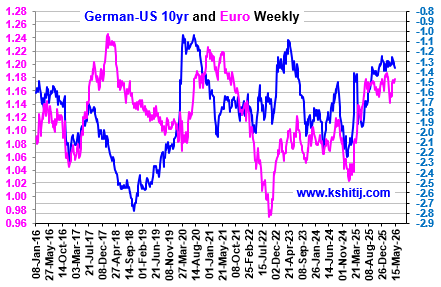
Many websites exhort you to “invest for your future” by trading forex. There is a big misconception here. Investing is closer to saving for the long term whereas trading is closer to buying and selling during relatively short periods of time. People can and do grow rich by doing either or both of these. But, by no stretch of imagination can trading on 1-minute and 15-minute charts be equated with “investing for the future”. This is not to say that there aren’t any genuine Investors in the currency markets. There certainly are, but their methods are different. They are the ones who would have been buying EURUSD in small lots on every 150-200 pip rise from 0.98 in March 2002 to 1.18 (at least) in May 2003. They might still be holding onto some of their positions, aiming for 1.40 next year. Why? Because they see the Euro as a better place to keep their savings than in the Dollar. As simple as that. They’re not into the FX sweepstakes or championships of the “I made 200%” kind.


CONTOURS/ PARAMETERS of the FX MARKET

It is important to know the contours/ nature/ parameters/ dynamics of the market you operate in. Here are some of the things we’ve been able to figure out (no guarantees as to correctness, though):


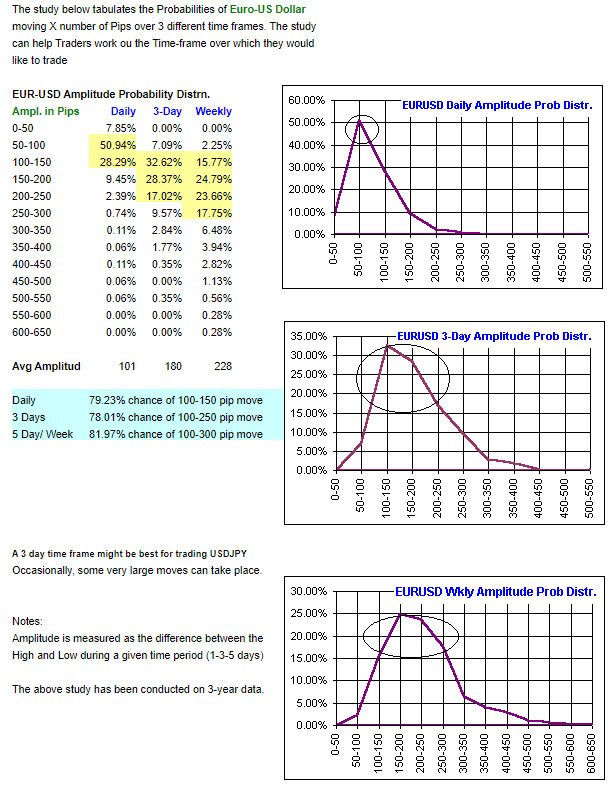
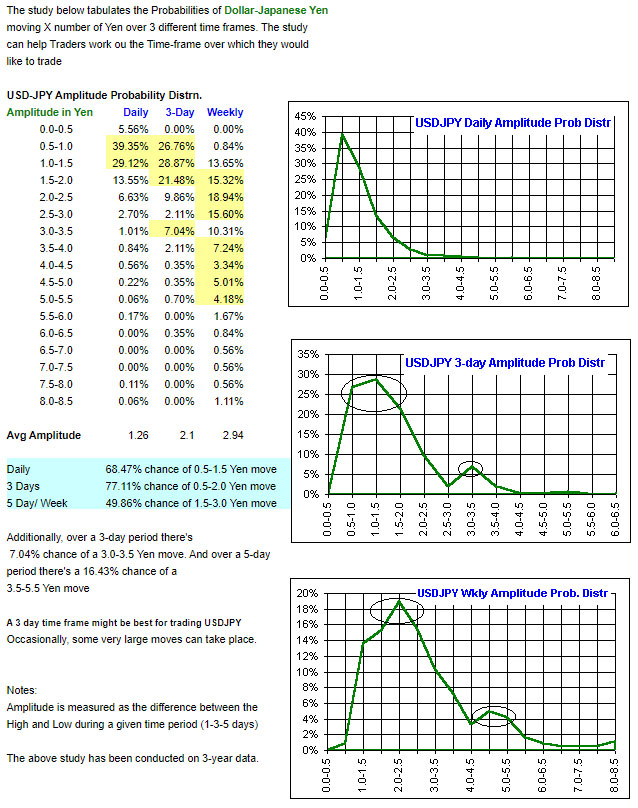
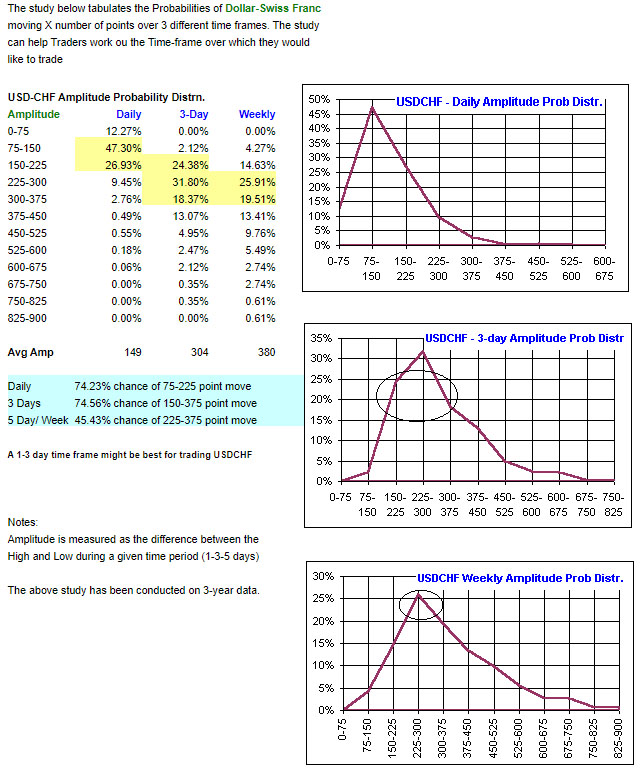
Low intra-day movements

Since the currency markets are very liquid and very big on volume, the margins are thin. Daily movements are also small, as compared to other financial markets, like Equities. While it is not uncommon for individual Stocks to move 2-3% on an intra-day basis, individual currencies usually move only 1.0-1.25% on an intra-day basis. As such, in the currency markets, it might be easier to make money (in the long run) by trading on an intra-week (or better still intra-month or intra-year) basis than on an intra-day basis. This is especially true for those who are not full time traders and are able to devote only a couple of hours a day to trading.

Reasonable returns
In any business, you are doing a reasonably good job if you are making a consistent 10% net profit on capital employed, or even if your net profit margin (to sales) is 10%. Most businesses generate returns in the 10-15% range. The numbers thin down considerably as you start to go over 20%. Similarly, very few investments (especially in today’s low interest rate environment) give you returns in excess of 6%. So, you would be doing very well if you generate 6% returns on your FX trading over the year (whether on an leveraged or unleveraged basis). In business, it pays to know what reasonable returns can be expected, and not to harbour unnatural expectations.


Low interest rates lead to low returns

The best of currency traders have been showing lower returns over the past few years, as compared to the 1990-95 period. In fact, we suspect that the same may be true for Equity and Bond traders in the G3 countries. Why? Its not they’ve all suddenly lost their touch. Look at the abysmally low interest rates prevailing worldwide (never mind the 25bp Fed rate hike last week). If the Interest Rate is the Cost of Capital, low interest rates tell us that there is very little demand for capital in the world right now. And if there is very little demand for capital, how can Traders of Capital (all currency, equity and bond market traders are essentially traders of capital) generate supernormal returns?


Perfect Competition

The currency market is the closest you can ever come to the textbook utopia of Perfect Competition. That being so, it is theoretically impossible for anyone to generate super normal profits.


SURVIVAL TIPS

Does all of the above mean that there’s no point in trading FX? Certainly not. Perhaps there’s no better market to trade than the currency market to trade in precisely because it is a perfect competition. While it is not possible to generate super normal profits for long periods of time in a perfect competition, it is also generally true that a perfectly competitive allows for survival and sustenance for all market participants. The only condition is that the Trader should not commit professional harakiri. Here are some Survival Tips that we’ve learnt from the School of Hard Knocks:

  • Trade Small, which also translates into “Don’t over leverage yourself”
  • In fact, if you are new to trading, do Paper Trading/ Demo trading for at least two years. But do it with complete honesty and sincerity. That way you’ll be saving a lot of tution fees which you would otherwise pay to the market. And learning will be cost less.
  • Spend the money you’ve saved thus, on books and services which give you good, down to earth advise. Such as ours, of course 🙂