

Series on Trading Chart Patterns - Part 1 - Trading Flags and Pennants; Long Term Trend Resistance in Sterling
Mar, 08, 2004 By Vikram Murarka 0 comments


A few words .... We used to bring out "The Colour of Money" as a weekly forecast of the currency markets some years ago and it used to be well appreciated by a few connoisseurs. However, we discontinued the service in March-2001 because not many people wanted to pay for weekly views and the intellectual drain of having to "drum up" a forecast within a weekly deadline was getting to be a bit much.
We are now reviving "The Colour of Money" as an initially free publication as a means of communicating with you, Dear Reader, and offering what comes to mind, hopefully of value. The emphasis right now is on serendipity and we are not going to be bound by a weekly or fortnightly deadline. That said, the effort would be to bring out a couple of issues a month. We hope you will look forward to seeing "The Colour of Money" in your mailbox in the coming weeks-months-years. But, if you would rather not have us waste your time or your mailbox space, please do let write back and we shall unsubscribe you. Thank you!
In this Issue
- Series on Trading Chart Patterns - Part 1 - Trading Flags and Pennants
- Long Term Trend Resistance in Sterling
Series on Chart Patterns
Part I - Flags and Pennants
 We start off with a series on some of the familiar chart patterns (knowledge of the patterns is assumed), trying to share our real-life trading experiences. Here goes:
Bull Pennant that worked
Flags and Pennants are Continuation Patterns in a trending market. They can be used for initiating new positions in the direction of the Trend or adding to existing positions.
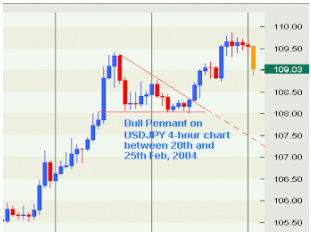
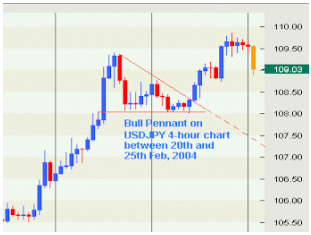
Look at the Bull Pennant in USD-JPY in the last week of Feb-04, in 4-hour chart alongside. The USD had risen vertically from near 105.50, forming the "Flagpole". Thereafter the market consolidated between 109.40 and 108.00 for 3 days bounded by the Horizontal Support near 108 and a declining Resistance (both shown in Red). The Price converged near 108.05 between these two lines and then broke upwards, out of the Pennant to rise to 109.80. A classic Pennant!
To Trade the Pennant
By the 23rd and 24th of Feb, it was clear that a Pennant was forming, since the Bottoms were forming a horizontal Support and the Tops were declining. Once known, the strategy was to take a Long position once the expected upward breakout started,say near 108.25. This was a Stop Loss Long Entry and the order was filled by mid-day on 25-Feb-04, Wednesday. The market rose more than 100 points after that, although the ideal profit target was in the 110+ region. Still, there was ample opportunity to take profit on the trade.
The best thing about trading Pennants (or Flags) is that they give you almost instantaneous profit, if they work. They second best thing about these patterns is that they are rarely ambiguous. You can know when and if they have NOT worked. As such, you can usually set a Stop Loss without fear of getting unnecessarily whipsawed.
For instance, the Stop Loss in the Trade above could have been set at 107.75. If triggered, it would have proven the Pennant incorrect. Also, the Risk: Reward Ratio was very favourable, at 50:100.
 Flag that did not work
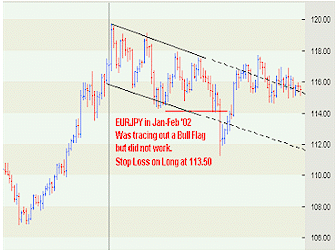
On the chart alongside, now, we have an example of a Bull Flag that did not work out. The EUR-JPY had been trending up through Nov-Dec 2001, forming the Flagpole of a potential Bull Flag that formed through Jan-Feb 2002. There SHOULD have been a huge upmove, had the Flag worked, but it did not. The market broke on the downside 07-Mar-02, falling to a low of 111.28 The important thing is that Long positions could have bailed out below 114, say near 113.75 or 113.50, meaning to say that both Flags and Pennants can be effectively traded with manageable and usually reliable Risk: Reward profiles.
Long Term Trend Resistance in Sterling
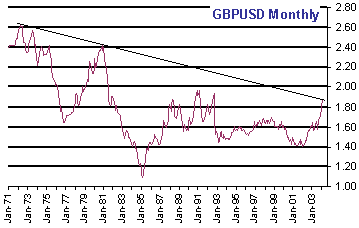 The Sterling has had an uninterrupted, almost exponential rise from 1.5608 (03-Sep-03) to 1.9142 (18-Feb-04). It has outperformed the Euro over the last few months driven by higher interest rates. A spectacular run, no doubt.
However, as can be seen in the chart alongside, it has run into a strong multi-year Trend Resistance, coming down from 1972, roughly the time the major currencies started to float. Save for the period Jan-93 (after the epic Soros-BOE battle) to Jan-99 (when the Euro was introduced), during which it moved sideways in a narrow range, the Sterling has been following an overall downtrend, albeit with large price swings.
In the present times, although a large section of the market remains Dollar-bearish over a 12 month time frame, the question is, do we have enough justification for a credible break of the extant long-term downtrend in the Sterling?
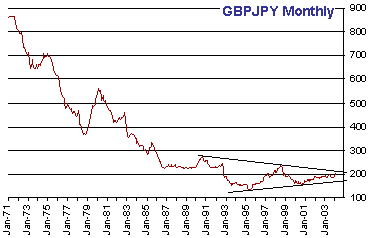 Our caution is buttressed by looking at the long-term GBPJPY chart (shown alongside), where we again see a strong Trend Resistance near the current market level of 207.45. Agreed, we have a sideways trading Wedge on the GBPJPY Cross chart and a breakout will eventually take place, but there may still be at least a couple of months before that happens - unless there is a huge upsurge in USDJPY.
Even in such an event (upsurge in USDJPY), we will not have a clearly bullish upmove in GBPUSD. And, if one of the leaders of the Dollar selloff since Sep-03 begin to tire, it would be good to be cautious on more USD Short positions.

You may also like:
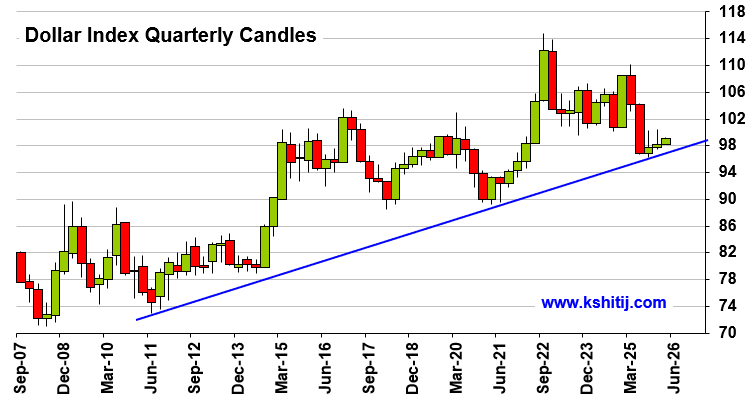
In our 10-Dec-25 report (USDJPY 156.70), we expected the USDJPY to trade within 154-158 region till Jan’26 before eventually rising in the long run. In line with our view, the pair limited the downside to … Read More
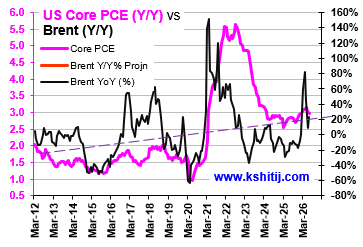
In our last report (04-Sep-26, UST10Y 4.77%) we had noted chances of a slowdown ahead but since Crude could spike up, we retained our view of the US10Yr rising to 5.10% by Nov-26 and 5.40% by Mar-27. As it turns out, Brent did indeed rise to …. Read More
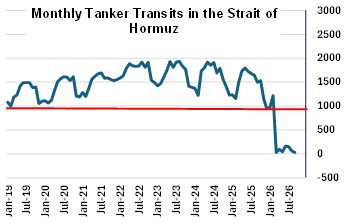
In our September 2026 report (11-Sep-26, Brent @ $103.84), we had expected Brent to range within $90-115 for the next 1year. Prices were expected to remain elevated, primarily driven by the low volume of vessel transit in the Strait of Hormuz. Brent indeed traded within $109.97 and $90.70 in Sep-26, within our expected range. … Read More
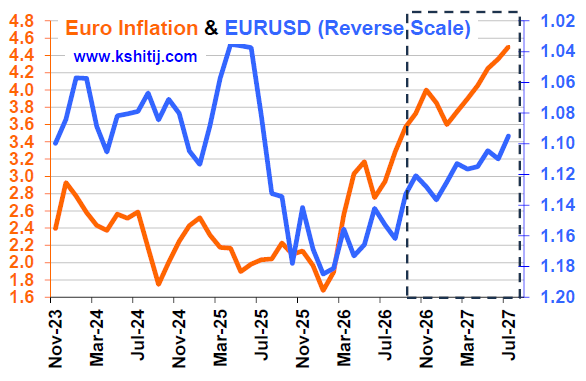
In our September 2026 report (4-Sep-26, EURUSD 1.1620), we revised our Euro forecast upwards due to lack of followthrough selling below 1.14. We expected the Euro to range between 1.1980-1.13 for the next 1yr. However, in line with our earlier bearish outlook, the Euro fell sharply to …. Read More
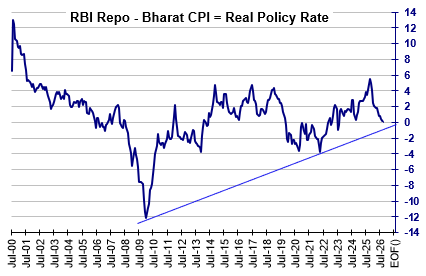
In our 10-Sep-26 report (10Yr GOI 6.98%), we had noted that the Long end of the Curve, viz. the 10Yr GOI was rising due to a number of factors. We said, “Whether the RBI will raise rates on 07-Oct will depend on whether Crude happens to be breaking higher or would have cooled off from $105 to $95” … Read More

Our October ’26 Dollar Rupee Quarterly Forecast is now available. To order a PAID copy, please click here and take a trial of our service.