

followup-in-sterling
Mar, 28, 2004 By Vikram Murarka 0 comments


FOLLOW UP - Bear SHS in Sterling?
In the last issue we had pointed out a three decade old Downtrend Resistance on the GBPUSD Monthly chart, which presaged weakness in GBPUSD. Technical Analysis is based on the assumption that ALL factors governing Price are in the Price itself and we can predict Price movements through the study of Charts. This assumption seems to be proving correct yet again. The Sterling seems to be developing a Bearish Shoulder Head on the Weekly chart (shown alongside), confirming the prognosis of the monthly chart.
If this works, Cable can fall to 1.73-1.70 over the next 4-8 weeks Negation would need a Week Close above 1.8589, as compared to the current level of 1.8158.

You may also like:
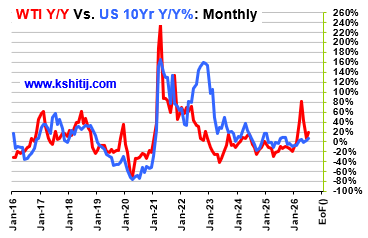
In our last report (29-Jun-26, UST10Y 4.39%) we had followed the fall in Crude to $73 to change our US10Yr forecast from a rise to 5.10% by Sep-26 to a slight dip to 4.30% by Sep-26; and instead of the earlier forecast of a rise to 5.4% by Jan-27, the changed forecast projected …. Read More
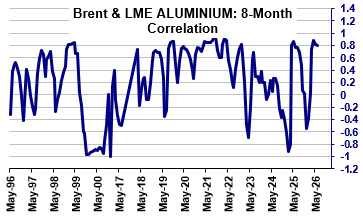
In our June 2026 report (1-Jun-26, Brent @ $95.47), we had expected Brent to correct to $88 before bouncing back to $120 and $145 by Aug-26 and Sep-26, respectively. A sustained trade below $90 was said to be incumbent on a fully credible resolution of the US-Iran war. … Read More
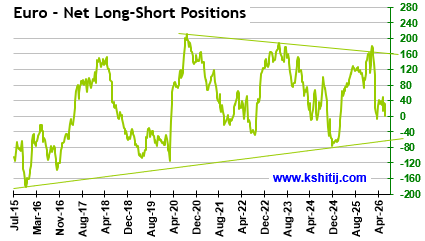
In our June 2026 report (10-Jun-26, EURUSD 1.1546), we expected the Euro to rise towards 1.17 in Jun-26 before reversing lower, with surging crude prices, rising inflation, and potential central bank rate hikes posing key risks amid the ongoing US-Iran conflict …. Read More
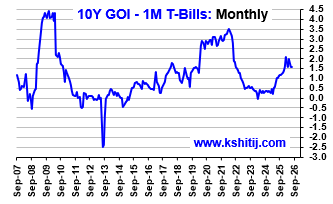
In our last report on 03-Jun-26 report (10Yr GOI 7.03%) we remained bullish on Brent and therefore called for higher CPI and higher Yields. At the same time, we said, “Our view will come under threat if Brent trades … Read More

In our 10-Dec-25 report (USDJPY 156.70), we expected the USDJPY to trade within 154-158 region till Jan’26 before eventually rising in the long run. In line with our view, the pair limited the downside to … Read More

Our July ’26 Dollar Rupee Quarterly Forecast is now available. To order a PAID copy, please click here and take a trial of our service.