

Amplitude Probability Distribution for Currencies
Apr, 26, 2002 By Vikram Murarka 0 comments

It is important to know the characteristics of any market that we trade. This helps us approach the market with more awareness and reduces the element of surprise. It also helps us formulate our trading strategies.
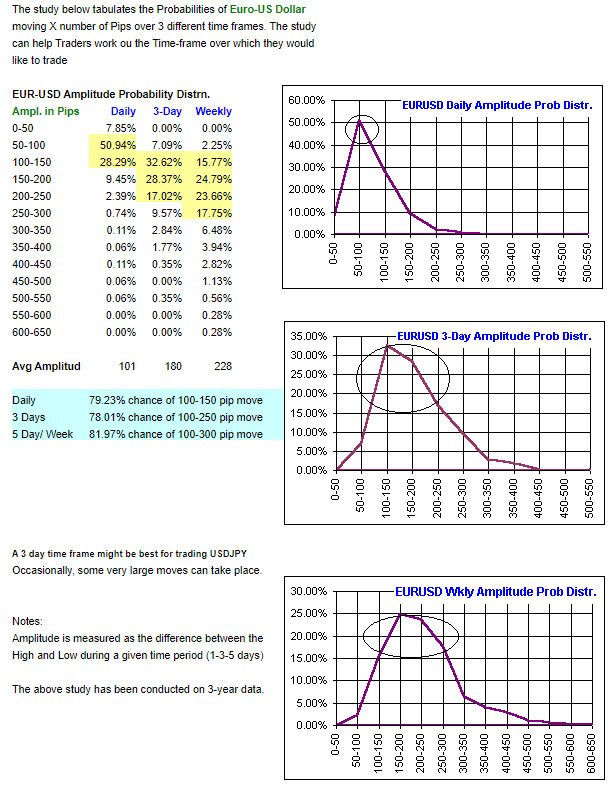
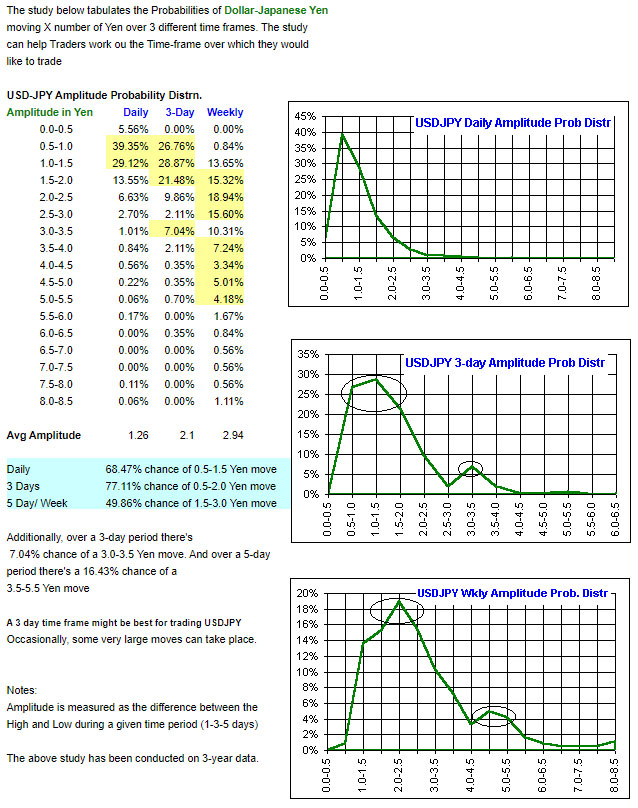
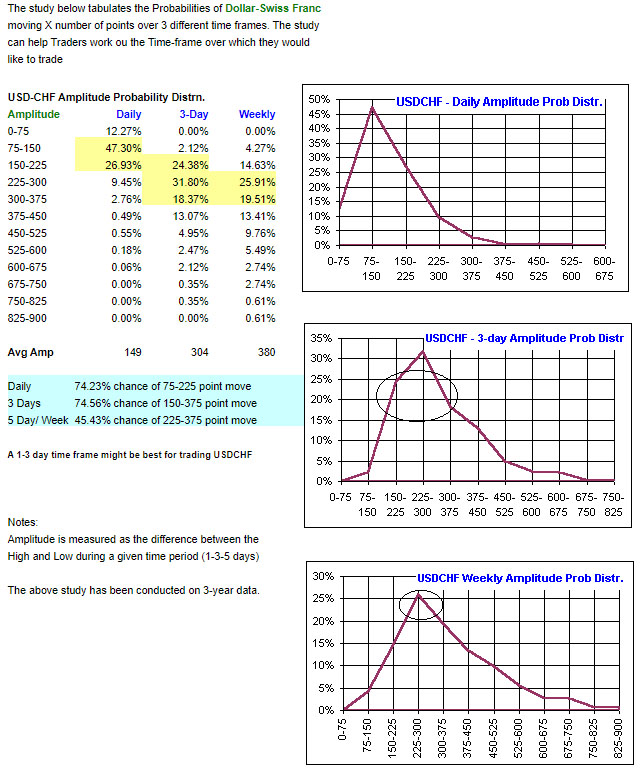
In the following pages we try to answer the question, "How much do currencies move over various time frames". We have examined price data for EUR-USD, USD-JPY and USD-CHF for the last 3 years to see what is the Amplitude (difference between the High and Low) for these currencies over 1, 3 and 5 day time frames.
We believe that this might be helpful in 1) enabling us to choose a suitable Time Frame for our trading activity and 2) forming an idea of how much profit/ loss might be reasonably expected in our chosen time frames.
Put into other words, this is also an examination of the Volatility of the subject currencies in various time frames.
Please click on
EUR-USD
USD-JPY
USD-CHF
EURUSD Amplitude
USDJPY Amplitude
USDCHF Amplitude

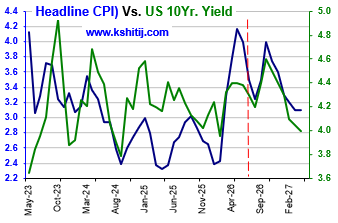
For the last few months we have been looking for Crude to rise towards $130-190 and pull up the US CPI towards 4.6% and the US10Yr Yield to 5.4% by Jan-27. This view has clearly gone wrong with Brent falling sharply below $90 as a result of the US-Iran peace deal, which is the …. Read More
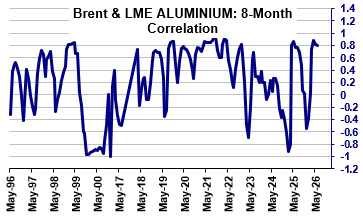
In our June 2026 report (1-Jun-26, Brent @ $95.47), we had expected Brent to correct to $88 before bouncing back to $120 and $145 by Aug-26 and Sep-26, respectively. A sustained trade below $90 was said to be incumbent on a fully credible resolution of the US-Iran war. … Read More
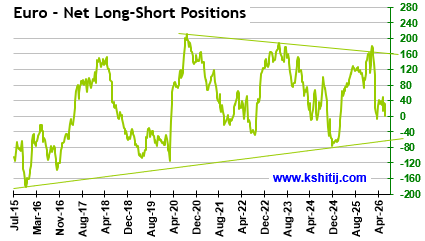
In our June 2026 report (10-Jun-26, EURUSD 1.1546), we expected the Euro to rise towards 1.17 in Jun-26 before reversing lower, with surging crude prices, rising inflation, and potential central bank rate hikes posing key risks amid the ongoing US-Iran conflict …. Read More
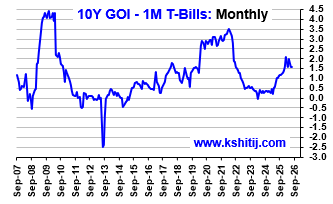
In our last report on 03-Jun-26 report (10Yr GOI 7.03%) we remained bullish on Brent and therefore called for higher CPI and higher Yields. At the same time, we said, “Our view will come under threat if Brent trades … Read More

In our 10-Dec-25 report (USDJPY 156.70), we expected the USDJPY to trade within 154-158 region till Jan’26 before eventually rising in the long run. In line with our view, the pair limited the downside to … Read More

Our July ’26 Dollar Rupee Quarterly Forecast is now available. To order a PAID copy, please click here and take a trial of our service.