

Never 0, never 100, and not in one go!
Apr, 10, 2012 By Vikram Murarka 0 comments


One of the most agonizing difficulties commonly faced by the risk manager is not knowing where the market is likely to go. This makes it nearly impossible for him to decide whether to hedge or not to hedge. To put an end to his indecision, and not knowing what to do, he often leaves the exposure unhedged. His line of thought is, "Who knows whether taking a hedge will be right or wrong? It is better not to do anything. Who will take the blame if things go wrong?" Very often, the CFO/ CEO/ MD also agree with the risk manager, coming up with a number of justifications for the decision.
The strategy of inaction works well enough if the market is either stable or is moving in favour of the exposure. Unfortunately, the happy state of affairs does not last forever and the risk manager often ends up hedging in a state of panic when the market starts to go against him.
Underlying the above practice are two misconceptions:
- The risk manager has a responsibility to hedge at the highest rates (for exports) and lowest rates for imports.
- When he hedges, the risk manager should hedge 100% of the exposure.
However, the seasoned risk manager knows that it is not possible to strike the tops and bottoms of the acceptable average rate for the hedge. The simple trick he employs is to hedge the exposure in parts instead of as a whole. He might break up the exposure into 3 parts, or 4 parts or even 10-12 parts, and then proceed to hedge each part at different rates and at different times in the market.

Since the hedges are undertaken at regular intervals, when the risk manager follows this strategy consistently over a sufficiently long period, he gets several benefits, as enumerated below:
- Is able to achieve a decent average rate.
- Does not have to worry about trying to achieve the highest or lowest rates. Or in other words, he does not have to try and "time" the market.
- Even if a couple of forecasts, on which the hedges are based, go wrong, it is not a major worry because (a) the wrong forecast does not impact the entire hedge and (b) there are good chances that subsequent forecasts will go right.
- Dramatically reduces the arbitrariness and ad-hocism in the hedging process and greatly enhances the systematic aspect of hedging.
- All of the above, together, make the whole hedging process much more robust than if each exposure were to be hedged in one go.
Further, it has been our experience that in the hands of a skilled risk manager, this strategy can go so far as to help the company achieve an average realization rate that is better than the average market rate.
So, remember, do not leave your exposure totally unhedged, do not cover it fully at one go. Try and hedge in steps.

You may also like:


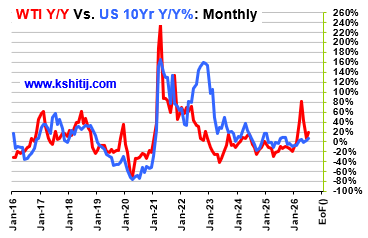
In our last report (29-Jun-26, UST10Y 4.39%) we had followed the fall in Crude to $73 to change our US10Yr forecast from a rise to 5.10% by Sep-26 to a slight dip to 4.30% by Sep-26; and instead of the earlier forecast of a rise to 5.4% by Jan-27, the changed forecast projected …. Read More
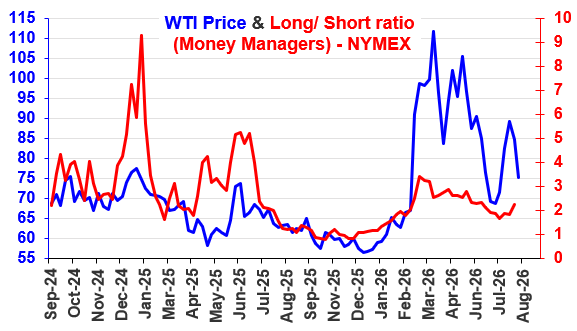
In our July 2026 report (6-Jul-26, Brent @ $71.94), we had expected Brent to test $64 before consolidating within the $64-90 range till Mar-27. Thereafter, the prices were expected to slowly rise back to … Read More
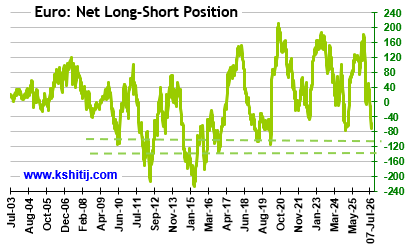
In our July 2026 report (10-Jul-26, EURUSD 1.1442), we expected the Euro to rise from support at 1.13 to 1.16 by Aug-26 before resuming its broader downtrend towards 1.12 by Oct-26 and 1.0950 by Jun-27. In line with this, the Euro tested 1.1547 in July-26 and 1.1581 in Aug-26, the recent rise triggered by weakness in …. Read More
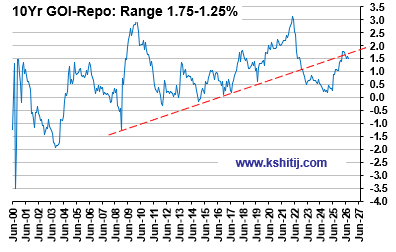
Our last report on 13-Jul-26 report (10Yr GOI 6.74%) stood on a foundation of uncertainty regarding what happens in the Strait of Hormuz. We assumed that Crude would remains below $90, and hence we projected … Read More
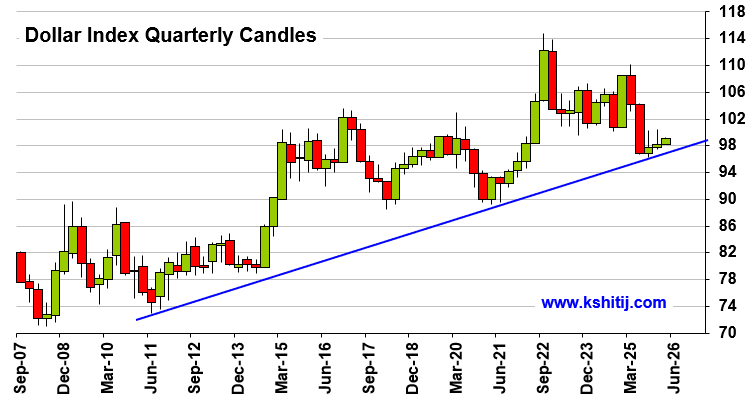
In our 10-Dec-25 report (USDJPY 156.70), we expected the USDJPY to trade within 154-158 region till Jan’26 before eventually rising in the long run. In line with our view, the pair limited the downside to … Read More
Our August ’26 Dollar Rupee Monthly Forecast is now available. To order a PAID copy, please click here and take a trial of our service.