

Euro Long term Forecast – May’17
May, 09, 2017 By Vikram Murarka 0 comments

9-May-17 / Euro 1.0907
EXECUTIVE SUMMARY:
Recap: In our April’17 report, we expected Euro to be stable in the range of 1.05-1.10 for a couple of months followed by an expansion of the range with equal chances of a breakout on either side.
There is no change in view as Euro tested but failed to break above the major resistance of 1.10. A break above 1.10 is a necessary condition for further rise to 1.12 and 1.15 but the downside risk remains open till the breakout is seen.
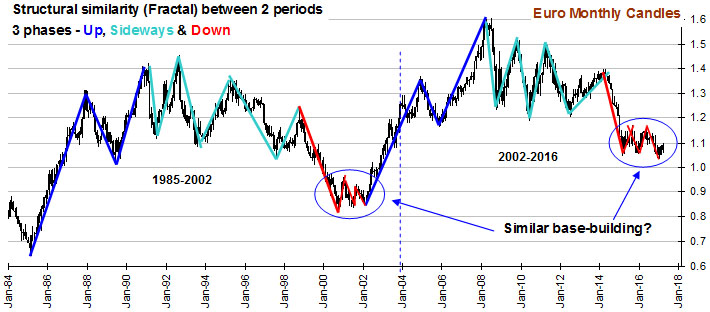
The chart above shows the structural similarity between two different phases of Euro. It definitely looks like Euro is repeating the structure seen in 1985-2002 since the rally of 2002. In both the cases, the bull market took place in 3 legs (marked by blue lines), sideways consolidation in 6 legs (marked by indigo lines) and a bear market starting with a sharp decline (red lines). Will the current sideways consolidation really turn out to be mirroring the consolidation seen in 2000-02? We don’t know yet but the probability can’t be discarded keeping in mind the overwhelming similarity in its entirety. If the similarity continues, then we can expect a new bull market starting, probably in 2018.
Volatility compression
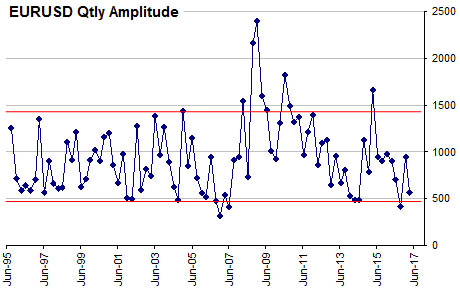 The chart on the left shows the quarterly amplitude of Euro or in other words, how much it has moved in a quarter, placed on the time axis to catch any emerging pattern.
We can see the amplitude primarily oscillating around 1000 pips but in the last quarter, the movement has been limited in a much narrower range of 567 pips.
With the broader range defined by 500 to 1500 pips for the last 20 years, an expansion of the amplitude can be expected in the current quarter, implying a sharp directional move.
With 60% of the current quarter still left, the current quarter amplitude stands at 432 pips which look unsustainable. That means, either the current quarter low of 1.0568 or the high of 1.1000 must give way. We have no directional bias inside 1.05-1.10 as discussed previously and prefer to wait and watch.
Correlation between Euro and Swiss
 |
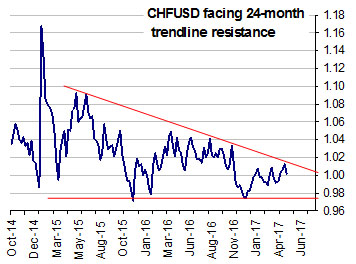 |
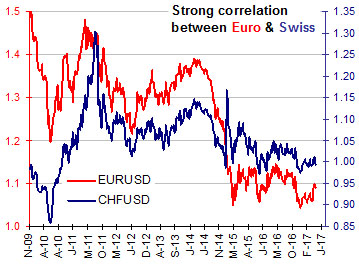
The chart on the left side shows the strong correlation between Euro and Swiss (USDCHF inverted). Swiss was pegged to Euro in the period of 2011-2014 but despite the peg broken in Jan’15, Swiss continues to mirror Euro. As the right chart shows, Swiss (USDCHF inverted) has strong resistance near 1.02-1.03 and an immediate break above 1.02-03 looks difficult, which may cap the near term upside for Euro to 1.10.
Quarterly Projections
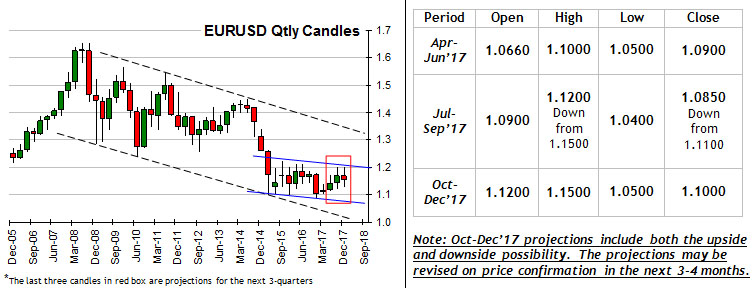
Conclusion
Euro could be stuck within the broad 1.10-1.05 region in the coming months with no strong directional clue visible. Any failure to rise from either 1.10 may push it down towards 1.07-1.06 but the downside may be limited to 1.04 for the current year.

You may also like:

For the last few months we have been looking for Crude to rise towards $130-190 and pull up the US CPI towards 4.6% and the US10Yr Yield to 5.4% by Jan-27. This view has clearly gone wrong with Brent falling sharply below $90 as a result of the US-Iran peace deal, which is the …. Read More
In our May 2026 report (4-May-26, Brent @ $110.75), we expected Brent to test $90.50 by Jul-26, followed by a rise to $145.13 by Sep-26 and $161.93 by Dec-26. Sustained trade below $100 was expected to be seen only on a credible resolution of the US-Iran war, which looked unlikely … Read More
In our May 2026 report (11-May-26, EURUSD 1.1762), we expected the Euro to rise to 1.1950 by May-26 before falling towards 1.16-1.14 in the coming months. We delayed the fall to 1.10 from the earlier expected Aug-26 to Mar-27 as the Dollar Index remained within a broad range for more than expected …. Read More

In our 11-Apr-26 report (10Yr GOI 7.03%) we had retained our bullish view on Brent towards $134 by Sep-26, while allowing for a near term dip to $95 on hopes of a US-Iran resolution. Brent fell to $89.93, lower than … Read More

In our 10-Dec-25 report (USDJPY 156.70), we expected the USDJPY to trade within 154-158 region till Jan’26 before eventually rising in the long run. In line with our view, the pair limited the downside to … Read More

Our June ’26 Dollar Rupee Monthly Forecast is now available. To order a PAID copy, please click here and take a trial of our service.