
Japanese Yen Long term Forecast - Jan'18
Jan, 19, 2018 By C S Vijayalakshmi 0 comments

15-Jan-18: USDJPY 110.70 / EURJPY 135.28
RECAP
In our Sep’17 report, we had mentioned a possible range of 106-115 for the period of Oct’17 to Mar’18. The actual movement has been between 114.74 (high Nov’17) and 107.32 (low Sep’17) so far, well within our mentioned range.
EXECUTIVE SUMMARY
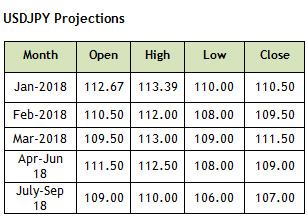
Dollar Yen is expected to trade in the 110-113 region in the next two months, both being important support and resistance levels. Thereafter a break on the downside towards 106.00 would be preferred.
LONG TERM: BEARISH FOR 110-108-106
 |
 |
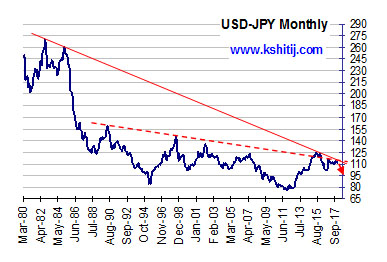
The USDJPY Monthly charts show that the exchange rate is currently trading below very long term resistance coming down from 272 (Oct’82) and while that holds, Dollar-Yen is likely to come off towards 108-106 or lower in the longer term. We do not expect a breach of this resistance just now and prefer Yen strength in the longer run.
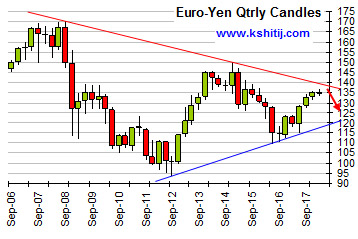
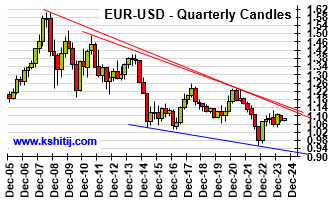
The second chart above is the EUR-JPY quarterly candle chart which indicates that the cross-pair is headed towards resistance near 139-140 in the near term. The pair may test resistance in another 1-2 quarters before coming off towards 130-125 or lower in by the Dec’18-Mar’19. Assuming 125 on Euro-Yen and 1.15 on Euro-Dollar, we get a projection of 108.65 on Dollar-Yen.
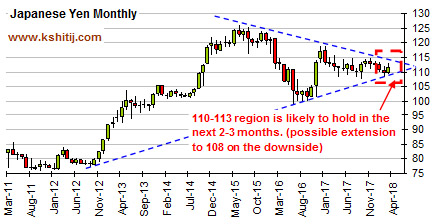
MEDIUM TERM: RANGED BETWEEN110-113 FOR A FEW MONTHS
The price range has been narrowing down since almost a year, keeping Dollar-Yen within 115-108 region since Mar ’17 almost. It could remain trapped within this 113-110 region for another couple of months with an outside chance of extension towards 108 on the downside.
 |
|
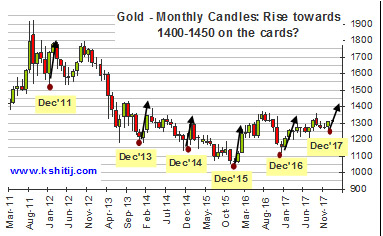
RISE IN GOLD COULD FAVOR YEN STRENGTH
 |
 |
The study of historical price movements in Gold (left hand chart above) shows that December tends to form short term lows producing a bounce that lasts for the next 2-3 months. This suggests that the Dec’17 low of 1236.50 can hold at least till March’18 with a possible bounce towards 1400-14500 over the next couple of months.
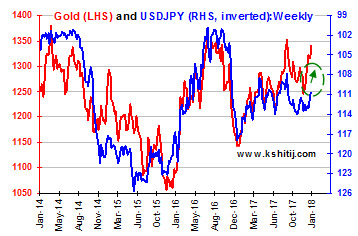
The second chart on the right shows positive correlation between Gold and the Yen (note that USDJPY is shown in inverted scale on the RHS axis) i.e. as Gold rises, Yen strengthens and vice-versa. As inferred from the first chart, we expect Gold to move up towards 1400-1450 by March’18 thereby giving more weightage to Yen strength towards 110-108 levels.
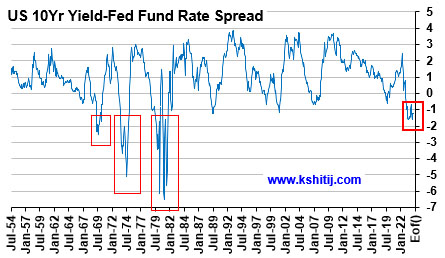
DECLINE IN US-JAPAN 10Yr YIELD SPREAD LEADS TO DOLLAR YEN DECLINE
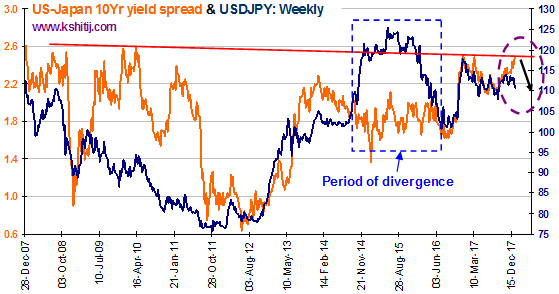 The US-Japan 10YR yield spread and the Dollar Yen has overall shown positive directional correlation as shown in the chart alongside.
Although there has been an instance of divergence in the Oct’14-May’16 period, the overall correlation has resumed after May’16 and we may expect it to hold in the coming weeks too.
The Yield spread (2.47%, shown above) is testing resistance at current levels and is likely to come off from here towards 2.2% in the next few weeks. If that happens, Dollar Yen may come down in the near term towards 110-108 levels. This is also supportive of Yen strength as discussed in the last page.
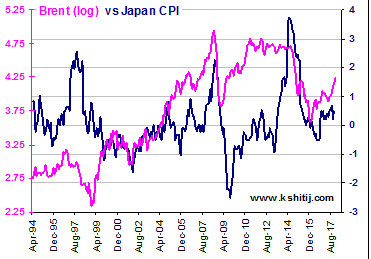
CORELATION BETWEEN JAPAN CPI (Y/Y%), BRENT CRUDE AND USD-JPY
 |
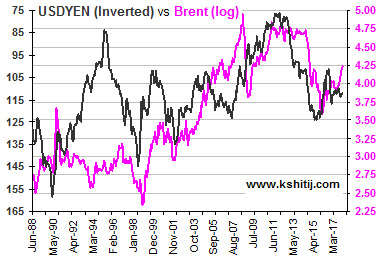 |
Our study above indicates broad directional correlation between the log chart of Brent Crude with Japan CPI (left hand chart above) and Dollar-Yen (right hand chart above). The recent rise in Brent from levels near 48.8 to current levels of 69+ is likely to be reflected in the Japan Dec’17 (to release on 26-Jan-18) and Jan’18 CPI figures. The rise in Brent and Japan CPI, if seen in the coming months could overall lead to further Yen strength, as rising inflation could induce a rise in Japanese yields, which would in turn bring the US-Japan Yield Spread lower.
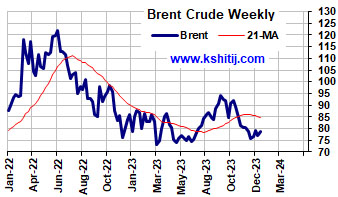
BRENT STABILITY COULD KEEP YEN STABLE
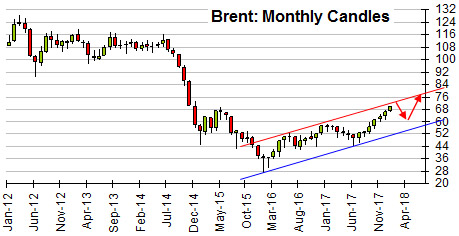 Crucial resistance is seen near 70 on Brent as seen in the chart alongside.
A corrective fall in Brent from 70 towards 65 in the coming months, could keep Dollar-Yen stable between 110-113 in the next couple of months.
Thereafter, an eventual break above 70 on Brent could push Dollar-Yen lower below 110 in the longer term, through the mechanism described above.
CONCLUSION
We look for consolidation between 110 and 113 for the next couple of months. Thereafter, a sharp rise in Brent above 70 could trigger Yen strength towards 108-106 by September 2018.

C S Vijayalakshmi
Vijayalakshmi has the rare ability to look at charts using both Classical charting as well as Elliot Waves, which she combines with excellent proficiency in Excel. A growing presence in the social media sphere, she is also an accomplished danseuse and choreographer.
Array
You may also like:
In our last report (23-Feb-24, US10Yr @ 4.25%), we had laid out our near term view (that the ongoing rise in the US10Yr may/ may not extend up to 4.5%), our medium term view (that the US10Yr can still fall to 3.5%) and our long term view of a rise towards 5.0% and higher going into 2025. …. Read More
After breaking above the earlier range of $70-85, Brent has moved up higher. Will it sustain and break above $90? Or will it fall back to $80/70? … Read More
Euro could not move above 1.0981 in March and has been trading well below 1.10 post the surprise rate cut by SNB last month. Will Euro continue to trade below 1.10? Or can it remain stable for a while and show a sharp breakout above 1.10? ……. Read More

Our April ’24 Quarterly Dollar-Rupee Forecast is now available. To order a PAID copy, please click here and take a trial of our service.
Our March ’24 Monthly Dollar-Rupee Forecast is now available. To order a PAID copy, please click here and take a trial of our service.