Author Archives: Vikram Murarka

About Vikram Murarka

Chief Currency Strategist at KSHITIJ.COM. Likes to look at the markets from many different angles. Weaves many conventional and unconventional technical analysis techniques and fundamental analysis into a global macro perspective. Likes to take the road less traveled.

98% of companies do not use specialized software to track their exposures (like Letters of Credit, Buyers’ Credits, Rupee Packing Credit etc) and hedges (like Forward Contracts and Options). All the work is, unfortunately, done on MS Excel. Truth be told, this is one of the biggest problems in forex risk management, possibly as big, or even bigger, than managing the market risk itself.

Maintaining forex data on MS Excel is tedious, time consuming and prone to errors. In 10% of companies, this work is undertaken by highly competent executives who are well versed with Excel functions, formulae, macros, pivot tables et al. In another 20-30% of companies, those maintaining the data are reasonably proficient in Excel. Unfortunately, in more than 50% of the companies, especially in SMEs, the work of maintaining the data is done by clerical staff that is, many a times, unaware of some of the basics of MS Excel.

This can prove to be a very big hurdle in getting correct and timely information on forex exposures, making it impossible to manage the market risk effectively.

Most companies do not use specialized forex software because affordable software suited to Indian conditions did not exist till very recently. There is good news on that front, though. There is an Indian company in Bangalore that has written a specialized software for tracking forex exposures and hedges. If you would like to know more about it, please write to us at info@kshitij.com.

Coming back to the topic, in this article, I will give you ONE tip on how Excel can be used better for the purposes of forex risk management. Many of you may already know this first tip that I am going to share below. In the next article I’ll give you another tip and there are good chances that the second tip will be a new one for you. Either way, make sure you show this to your junior staff members, who prepare your forex exposure and hedging reports for you.

Calculate Due Date automatically in Excel
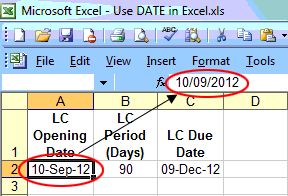
Enter the Date in DATE format in Excel

All companies have to track various due dates for transactions like LCs, buyers’ credits, interest payments, forward contracts etc. Here is an example of how Excel can be used to make life easier.

Let us take the example of a Letter of Credit. Some people enter the Date in TEXT format. They then calculate the LC Maturity Date on a calculator and again enter it in TEXT format in the next column. And then, if the LC Period is extended, they calculate the Maturity Date manually all over again! This is like having a car, a driver, a tank full of petrol and still going walking to work. Instead, all you have to do is enter the Date in DATE format. You can then use the date in calculations to automatically arrive at the due date. This is not possible if you enter the Date in TEXT format.

Enter the LC Opening Date in DATE format and the LC Period in NUMBER format. Then the LC Due Date can be calculated by Excel using the formula “LC Opening Date + LC Period”. Simple? Of course. Excel is meant to do that for you. Obvious? Yes.

Why enter Dates in DATE format?
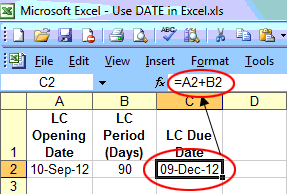
Calculate-with-DATE

When you enter a date in DATE format, instead of TEXT format, you can

Do addition and subtraction on Dates, as shown in the example above. This is useful for calculating various due dates, and for calculating things like Interest Period when given two dates. The ability to calculate automatically makes life easier when LC or BC are extended.
Sort data on Date. This is useful to sort things like LCs or Forward Contracts on their due dates and put them into monthly buckets. You can then use this date-sorted data to figure out the period for which your forex risk is most acute, so that you can take hedges accordingly.

TIP:
I prefer recording dates as to read as 10-Sep-12. This avoids confusion between 10-09-12 and 09-10-12, which has started to come from people using different conventions and data files coming from different places. All you have to do is go to the relevant cell and type in “10Sep12” and hit Enter. The data will automatically appear as “10-Sep-12”, in DATE format.

DO, enter your dates in DATE format, preferably as “10-Sep-12”

DON’T enter your dates in TEXT format. Then they are useless to you in Excel. They might as well be in Word, where you can’t use them in calculations!

In the next article I will talk about a more advanced Excel tip. Keep an eye out for that.

NEED A FOREX SOFTWARE?

In case you have been feeling the need for a dedicated forex exposure management software, you can write to us at info@kshitij.com

We can put you in touch with this Bangalore company that has developed exactly such a software for India.

SUMPRODUCT Way of Calculating Weighted Avg

Excel Tip 2 – Use SUMPRODUCT for Weighted Average

Here’s another very important MS Excel tip, one that I got from one of our clients. It has made my life so much simpler. Thank you, Krishnan!

Need for Weighted Average

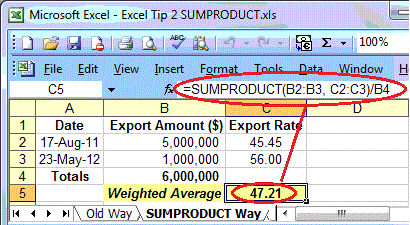
Let us say there is a company that exported goods worth $ 5 million and received payment at a Dollar-Rupee rate of 45.45 on 17-Aug-11. It then exported goods worth $ 1 million and received payment at a rate of 56.00 on 23-May-12.

What is the average rate at which the exports have taken place? You will be surprised at the number of people who reply saying 50.7250, the simple average of 45.60 and 56.00. However, as you know, the correct answer is actually 47.21, since the larger amount of $ 5 million was exported at the lower rate of 45.45 in August 2011, as compared to the smaller amount of $ 1 million which was exported at 56.00 in May 2012. The rate of 47.21, the weighted average rate calculated as (45.45 x 5 mln + 56.00 x 1 mln)/ 6 mln.

Not only do the export/ imports/ forward contract/ option transactions take place at different exchange rates, the transaction amounts are also always different. Therefore, there is always a need to calculate the weighted average rate at which forex transactions have taken place. Since the transaction amounts are different, calculating simple average is simply wrong.

Thankfully, while a few people do erroneously make do with a simple average, most people calculate the Weighted Average Exchange Rate. Unfortunately, the way most people (I was one of them) do the calculation is quite cumbersome.

Old Way of Calculating Weighted Average

Old Way of Calculating Weighted Average

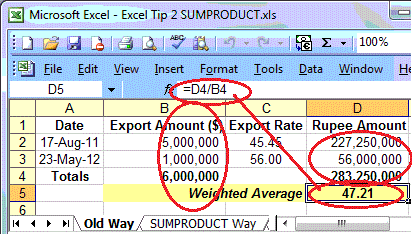
The way I used to calculate weighted average earlier in Excel is as follows:

Calculate the Rupee equivalent of the Dollar amount
Sum the Dollar amounts
Sum the Rupee amounts
Divide the sum of Rupee amounts by the sum of Dollar amounts


SUMPRODUCT Way of Calculating Weighted Avg

SUMPRODUCT Way of Calculating Weighted Avg

Note the SUMPRODUCT function in the formula bar. The weighted average is now calculated as SUMPRODUCT(range with Dollar amounts, range with Export rates)/sum of Dollar amounts.

Much simpler, isn’t it? Thanks are due to Krishnan, my client at Marico Ltd, and to MS Excel. I hope this function will be as useful to you as it is to me!

Forecasting

FORECASTS: LOVE THEM? HATE THEM? USE THEM.

ForecastingForecasts and Accountability

Everybody loves a forecast and wants to know where Dollar-Rupee is headed. This is natural because forex is the business of every importer/ exporter. Even the RBI conducts a Professional Forecasters’ Survey every quarter in which it seeks the views of professional forecasters on various aspects of the economy, including the Rupee.

Yet, people tend to have very low respect for forecasters. This is not so much because their forecasts tend to go wrong. What people do not like is the lack of sense of accountability displayed by many forecasters, whether in banks, in companies, or outside. Even Shri G Padmanabhan, Executive Director, RBI lamented this fact at his recent “Goa to Goa” speech on 23rd August. He said, “If we accept that market makers/ analysts who often are in a position to influence the market sentiment tend to be either euphoric or despondent (at crucial market turning points), what is the accountability if their forecasts turn out to be widely wrong…?” The words in the brackets are ours

The Forecaster has a Responsibility

Forecasters need not be defensive on hearing the above statement. Accountability does not mean the forecaster has to make good the losses suffered by a client on account of an incorrect forecast.

However, forecasters should bring in accountability by (a) admitting to mistakes and correcting subsequent forecasts and (b) publishing a track record of the reliability of their forecasts based upon the directional and numerical accuracy of the forecast when compared with the actual market rates that occur afterwards; and pre-informing a prospective client of it.

We invite you, Dear Reader, to take a look at our track record by clicking on http://www.72pct.com

Further, suggesting proper ways to use a forecast is another way of discharging responsibility towards a client. We’ll take that up just a little later.

Seek Reliability, not Accuracy

Before that, the client too has to acknowledge that forecasting is not a science. It is an art, a skill, practiced in the most uncertain conditions. As such, the client needs to look for broad reliability, rather than expect pin-point accuracy.

Also, profits or losses come from the market itself, and would accrue to the exporter/ importer whether or not he uses a forecast. The job of a skilled forecaster is not to guarantee, but to help increase the chances of a profit and decrease the chances of a loss. So, wanting compensation for a wrong forecast is incorrect.

Of course, an unskilled forecaster might increase the chances of a loss. Therefore a client would do well to seek out the services of a reliable forecaster.

Three types of forecasts

Further, it is important to know that besides moving up or down the market also moves sideways. Most people tend to ignore the last possibility even though it generally has a large probability.

Also, sometimes the outlook is clear and sometimes it simply is not. Such a situation usually arises after the market has been ranged for a long time, and usually means that a big trend movement is going to take place once some news emerges that can break the uneasy equilibrium that exists at the time.

The forecaster should spell out the conditions as clearly as he can. And, the client should see what best he can do in the circumstances.

How to Use a Forecast

The question before an exporter/ importer is not whether he should hedge or not. He should. The questions are how much to hedge and how to hedge.

How much to hedge? The client should not hedge everything based on any one single forecast. This is because (a) any one single forecast of even a reliable forecaster has no more than a 50% chance of being correct and (b) prudent risk management says that one should never hedge 0%, nor 100% and certainly not at one go.

Small amounts should be hedged over a period of time, slowly building up to a full hedge.

How to hedge? The forecast should be used to choose the hedging instrument. If the forecast is that the Dollar will move up, the Importer can buy a Forward and the Exporter should buy a protective Put. On the flip side, if the Dollar is expected to fall, the Exporter should sell Forward and the Importer should buy a protective Call.

And when the market has been ranged sideways for a long time, both should buy protective out of the money Calls and Puts.

The important point here is that when the Exporter and Importer buy a Put or a Call respectively, they protect themselves against the danger of a forecast going wrong while allowing themselves the opportunity of benefiting if the forecast is right.

People would do well to sanction a hedging cost budget, in order to be able to buy Options. Remember, sanctioning a hedging cost budget is the first step to hedging success.

While forecasters should definitely act with responsibility, clients too can use forecasts better. Here’s to more effective risk management!

How much did you really pay/ receive?

How Much Did You Really PAY/ RECEIVE?

How much did you really pay/ receive?

The old financial year is over. The accounts are done and profit/ loss has been calculated. Hopefully you would have seen a good growth in turnover and profits. And, in the case of your Imports/ Exports, we certainly hope that you might have been able to avoid an exchange rate loss and show an exchange rate profit.

Looking at your forex risk management process, you would be keeping track of a number of rates. You normally keep a watch on the Spot Rate, the Forward Rate, maybe even option volatilities. In your weekly/ monthly exposure management reports you calculate your Import/ Export Book Rate (the rate at which your exposure is taken into your accounts at the time of its creation) and you calculate your hedge ratios. You also do mark-to-market calculations on your hedges. Besides all this, you also have to keep abreast of the global stock, commodity and money markets.

It is a lot of work, but it is necessary for prudent risk management.

Net Purchase/ Sale Rate

However, is it possible that despite all the hard work, you are totally unaware of that ONE vital variable that you really need to track? If you are an importer, do you know your Net Purchase Rate (NPR) for Dollars? If you are an exporter, do you know your Net Sale Rate (NSR)?

Simply, do you know how much you really paid for the Dollars you bought for your imports, or how much you really got for the Dollars you sold against your exports in the last month/ quarter/ year?

Use of the Net Purchase/ Sale Rate

Your actual net payment/ sale rate will give you the true picture of the effectiveness of your forex risk management policies and practices in clear and unambiguous terms. It is that one number which really matters because that is what impacts the CASH profit/ loss of your company.

There is a 99.99% chance that the rate at which your exposure (imports/ exports) is retired/ realized is going to be different from your “book rate” or the rate at the time you recognized your exposures in your accounts. If you do not hedge at all, your import payment/ export realization will happen at the Spot Rate on the date of import payment/ export realization. This is simple enough.

But, we all hedge in order to avoid the danger of a rise (or fall) in the Dollar as the case may be. We employ various techniques, tactics and tools to hedge. We rely on various forecasts. We spend a lot of time and effort on hedging. Some people believe in hedging 100% through Forwards on Day One. Some others do not hedge at all. Some people believe they can optimize their rate by trading in/ out of the market. Some people have a firm hedging policy that they stick to. Others keep experimenting with many different strategies. There are many approaches to risk management, with their own advantages and drawbacks. An earlier article in this series dealt with the drawbacks of common hedging methods

True Barometer of Effectiveness

Whatever be your own preferred approach to hedging, you can say your hedging has been effective/ profitable if, as an importer, your Net Purchase Rate (NPR) happens to be less than the Average Spot Rate (ASR). If you are an exporter, your Net Sale Rate (NSR) should be more than the Average Spot Rate (ASR).

In formulae terms:
Gain for an Importer = ASR – NPR
Gain for an Exporter = NSR – ASR

We suggest the above measure of effectiveness, because if you had not hedged, you would have got the Spot Rate on payment/ receipt date in any case. By hedging you should either pay less or receive more than that Spot Rate.

How to calculate the NPR/ NSR?

Say you are an Importer. Over a period of time, you might have hedged as follows:

  1. You would have hedged some part of your exposures using Forwards. Simple enough. And you might be having the wise policy of utilizing your hedges for actual payments, to the extent possible.
  2. Some part of your imports might have been hedged using Call Options. At maturity, some of them would have been exercised if the Spot on maturity was greater than the Strike. The others would not have been exercised and you would have paid for your imports at the Spot rate.
  3. A part of your exposures might have remained intentionally unhedged, because you should neither hedge 0% nor 100%, and you would have paid off those imports also at the Spot rate.
  4. During this period, you might have also engaged in some in-out-in-out forex trading on the Major currencies. Not necessary, but possible.

Given the above, you would calculate your Net Purchase Rate as shown in Example 1 below. As an Exporter, you can calculate your Net Sale Rate as shown in Example 2 below.

Example 1: Calculating Net Purchase Rate, for Importers
Calculating Net Purchase Rate, for Importers
Breakup of Individual Import Payments

The NPR or Net Purchase Rate during September 2012 has been 55.32. As the Weighted Average Spot Rate during the period has been 54.6404, the hedges have not done well.

Example 2: Calculating Net Sale Rate, for Exporters
Calculating Net Sale Rate for Exporters
Breakup of Individual Sale Receipts

The NSR or Net Sale Rate during September 2012 has been 55.42. As the Weighted Average Spot Rate during the period has been 54.6404, the hedges have done quite well.

Comparing Imports (NPR) and Exports (NSR)

If the NPR (55.32) is compared with the NSR (55.42) we see that Importers have paid less than Exporters and vice versa (of course). If some company has both Imports and Exports, it has earned a NET Profit of 10 paise per Dollar between the two.

Importantly, the above example also shows that there is scope even for a company with a Perfect Natural Hedge to earn a net positive net differential between the NPR and NSR. This is worth striving for.

For your own good

The Accounting Standards do not required to calculate your Net Payment/ Sale Rate. But, do so for your own benefit. You might be surprised by the results. As the Hindi saying goes, “Doodh ka doodh, pani ka pani ho jayega.”

Those who believe forex is their business and are really keen to do well in forex hedging, will take up the challenge.

India & USA Industrial Growth

Indian IIP Growth

Indian IIP data for Nov-14 (+3.8% y/y) was released on 12-Jan-15. It has moved up smartly from the -4.2%. growth for Oct-14. But is that unequivocal good news? This report looks at the Indian IIP growth from a couple of other perspectives. 

India IIP YoY Growth

Growth? Or stagnation?

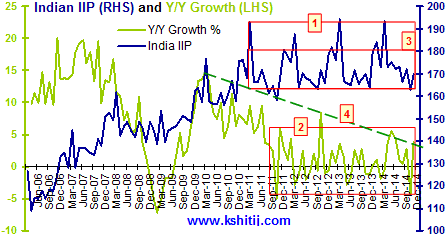
See boxes (1) and (2) in the chart alongside. For the last three years, the IIP Index has been ranging sideways between 194-163 and the annual growth rate between +6% and -4%, largely. Is this growth or stagnation?

The Index needs to rise past (3) or 180 at least if the growth rate is to move up to 5.9% at least. But (4) suggests there is trend resistance near the current levels

Further, we have to ask, even if the Industrial growth rate rises to 5.9%, is that good enough, given that India is looking to grow GDP itself at 5.9%? Industry probably needs to grow at least 8-10% if GDP growth is to move up to 5.9%. Recall, industrial growth was averaging 15-20% around 2007-08 when GDP was growing around 9%.

India & USA Industrial Growth

US growing faster than India

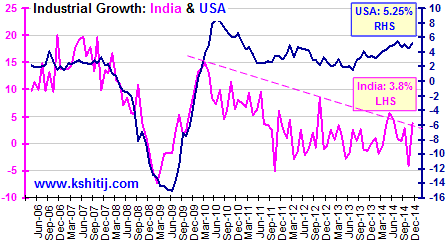
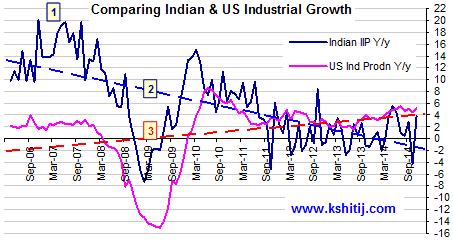
The chart alongside compares the industrial growth rate in India with that in the USA.

As can be seen, US grew 5.25% in Nov-14 as compared to India’s growth of 3.8%.

Further, the USA has pulled itself out of the financial crisis and growth has not dipped below even 1% since 2010. Indian industrial growth, on the other hand, has been vacillating around the 0% level since 2011.

Comparing Indian & US Industrial Growth

Seen on the same scale, (1) India averaged 15-20% in 2007-08, far outpacing the US growth of around 2% at that time. (2) But, Indian growth has been trending down since then whereas (3) US growth has been trending up.

Given that the US Industrial base is around 6 times that of India’s, growth in India will have to be at least 6 times more than the US growth rate for India to attract huge amounts of capital.

From a domestic perspective, Indian Equities have gone up through 2014 on the hope and belief that the new Modi-government will be able to pull India out of its economic morass. While that is still a hope an belief, we have to see what rate of Industrial growth is already priced into the current level of the Sensex/ Nifty.

We would assume that the Equity market is pricing in around 10% industrial growth. Unless the IIP picks up strongly in the next few months, the markets could start coming off.

On the other hand, if the IIP does indeed rise past 6% in the next few months, Equities could shoot up.

But, while the market has moved up on hope so far, further rise from here will have to be backed by performance. That could be a tall order, going by what the numbers suggest at the moment and considering the growth slowdown dogging the global economy.