

Excel Tip 2 - Use SUMPRODUCT for Weighted Average
Sep, 24, 2012 By Vikram Murarka 2 comments


Here's another very important MS Excel tip, one that I got from one of our clients. It has made my life so much simpler. Thank you, Krishnan!
Need for Weighted Average
Let us say there is a company that exported goods worth $ 5 million and received payment at a Dollar-Rupee rate of 45.45 on 17-Aug-11. It then exported goods worth $ 1 million and received payment at a rate of 56.00 on 23-May-12.
What is the average rate at which the exports have taken place? You will be surprised at the number of people who reply saying 50.7250, the simple average of 45.60 and 56.00. However, as you know, the correct answer is actually 47.21, since the larger amount of $ 5 million was exported at the lower rate of 45.45 in August 2011, as compared to the smaller amount of $ 1 million which was exported at 56.00 in May 2012. The rate of 47.21, the weighted average rate calculated as (45.45 x 5 mln + 56.00 x 1 mln)/ 6 mln.
Not only do the export/ imports/ forward contract/ option transactions take place at different exchange rates, the transaction amounts are also always different. Therefore, there is always a need to calculate the weighted average rate at which forex transactions have taken place. Since the transaction amounts are different, calculating simple average is simply wrong.
Thankfully, while a few people do erroneously make do with a simple average, most people calculate the Weighted Average Exchange Rate. Unfortunately, the way most people (I was one of them) do the calculation is quite cumbersome.
Old Way of Calculating Weighted Average
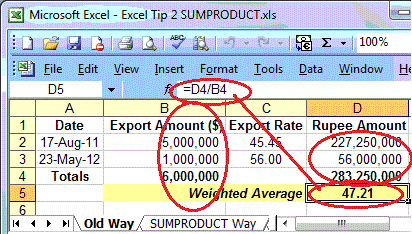
The way I used to calculate weighted average earlier in Excel is as follows:
Calculate the Rupee equivalent of the Dollar amount
Sum the Dollar amounts
Sum the Rupee amounts
Divide the sum of Rupee amounts by the sum of Dollar amounts
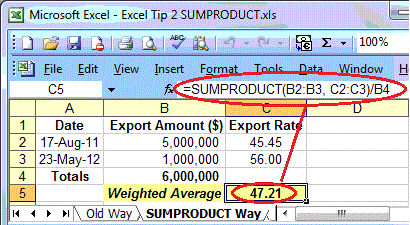
SUMPRODUCT Way of Calculating Weighted Avg
Note the SUMPRODUCT function in the formula bar. The weighted average is now calculated as SUMPRODUCT(range with Dollar amounts, range with Export rates)/sum of Dollar amounts.
Much simpler, isn't it? Thanks are due to Krishnan, my client at Marico Ltd, and to MS Excel. I hope this function will be as useful to you as it is to me!

You may also like:

In our 10-Dec-25 report (USDJPY 156.70), we expected the USDJPY to trade within 154-158 region till Jan’26 before eventually rising in the long run. In line with our view, the pair limited the downside to … Read More
In our last report (29-Jul-26, UST10Y 4.62%) we had said there were greater chances of rate hike on 16-September; we had also called for higher Yields, targeting 4.75% on the US2Yr, 4.80% on the US5Yr and 5.00% on the US10Yr. Both the prognoses seem to be …. Read More
In our August 2026 report (7-Aug-26, Brent @ $83.61), we had expected Brent to range within $70-100 for the rest of the year before eventually rising above $100 going into 2027. Brent has already risen to $109.97 in Sep-26 so far as the US-Iran conflict has re-escalated, impacting the transit activity in the Strait of Hormuz. … Read More
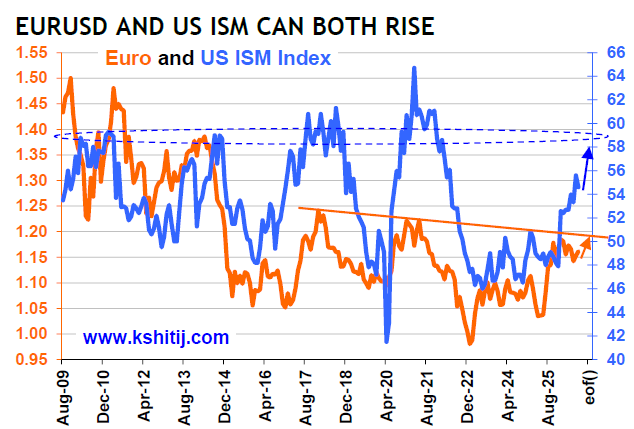
Euro has a positive correlation with US ISM since 2009, except in the period mid-2023 to mid-2025. Positive correlation suggests that while the US ISM rises in the coming months to 58-59, the Euro could rise or remain elevated within …. Read More

In our 05-Aug-26 report (10Yr GOI 6.82%), we projected a 6.63-6.95% range for a few months before a rise towards 7.10% by Jul-27, assuming Brent stayed within $75-95 before rising to $115. Brent is already up to $105, pushing the 10Yr GOI close to … Read More
Our September ’26 Dollar Rupee Monthly Forecast is now available. To order a PAID copy, please click here and take a trial of our service.