


Indian IIP Growth
Aug, 15, 2013 By Vikram Murarka 0 comments


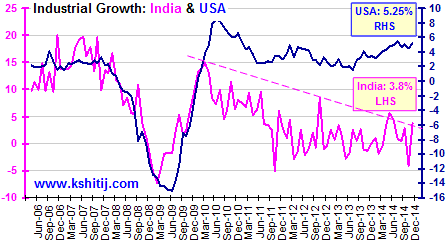
Indian IIP data for Nov-14 (+3.8% y/y) was released on 12-Jan-15. It has moved up smartly from the -4.2%. growth for Oct-14. But is that unequivocal good news? This report looks at the Indian IIP growth from a couple of other perspectives.
Growth? Or stagnation?
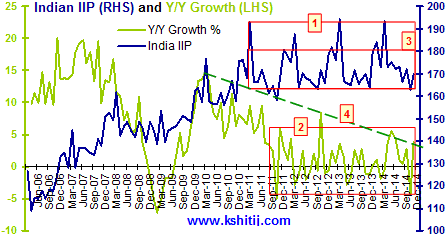
See boxes (1) and (2) in the chart alongside. For the last three years, the IIP Index has been ranging sideways between 194-163 and the annual growth rate between +6% and -4%, largely. Is this growth or stagnation?
The Index needs to rise past (3) or 180 at least if the growth rate is to move up to 5.9% at least. But (4) suggests there is trend resistance near the current levels
Further, we have to ask, even if the Industrial growth rate rises to 5.9%, is that good enough, given that India is looking to grow GDP itself at 5.9%? Industry probably needs to grow at least 8-10% if GDP growth is to move up to 5.9%. Recall, industrial growth was averaging 15-20% around 2007-08 when GDP was growing around 9%.
US growing faster than India
The chart alongside compares the industrial growth rate in India with that in the USA.
As can be seen, US grew 5.25% in Nov-14 as compared to India's growth of 3.8%.
Further, the USA has pulled itself out of the financial crisis and growth has not dipped below even 1% since 2010. Indian industrial growth, on the other hand, has been vacillating around the 0% level since 2011.
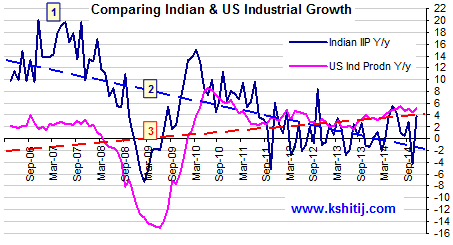
Seen on the same scale, (1) India averaged 15-20% in 2007-08, far outpacing the US growth of around 2% at that time. (2) But, Indian growth has been trending down since then whereas (3) US growth has been trending up.
Given that the US Industrial base is around 6 times that of India's, growth in India will have to be at least 6 times more than the US growth rate for India to attract huge amounts of capital.
From a domestic perspective, Indian Equities have gone up through 2014 on the hope and belief that the new Modi-government will be able to pull India out of its economic morass. While that is still a hope an belief, we have to see what rate of Industrial growth is already priced into the current level of the Sensex/ Nifty.
We would assume that the Equity market is pricing in around 10% industrial growth. Unless the IIP picks up strongly in the next few months, the markets could start coming off.
On the other hand, if the IIP does indeed rise past 6% in the next few months, Equities could shoot up.
But, while the market has moved up on hope so far, further rise from here will have to be backed by performance. That could be a tall order, going by what the numbers suggest at the moment and considering the growth slowdown dogging the global economy.

You may also like:

In our 10-Dec-25 report (USDJPY 156.70), we expected the USDJPY to trade within 154-158 region till Jan’26 before eventually rising in the long run. In line with our view, the pair limited the downside to … Read More
In our last report (04-Sep-26, UST10Y 4.77%) we had noted chances of a slowdown ahead but since Crude could spike up, we retained our view of the US10Yr rising to 5.10% by Nov-26 and 5.40% by Mar-27. As it turns out, Brent did indeed rise to …. Read More
In our September 2026 report (11-Sep-26, Brent @ $103.84), we had expected Brent to range within $90-115 for the next 1year. Prices were expected to remain elevated, primarily driven by the low volume of vessel transit in the Strait of Hormuz. Brent indeed traded within $109.97 and $90.70 in Sep-26, within our expected range. … Read More
In our September 2026 report (4-Sep-26, EURUSD 1.1620), we revised our Euro forecast upwards due to lack of followthrough selling below 1.14. We expected the Euro to range between 1.1980-1.13 for the next 1yr. However, in line with our earlier bearish outlook, the Euro fell sharply to …. Read More
In our 10-Sep-26 report (10Yr GOI 6.98%), we had noted that the Long end of the Curve, viz. the 10Yr GOI was rising due to a number of factors. We said, “Whether the RBI will raise rates on 07-Oct will depend on whether Crude happens to be breaking higher or would have cooled off from $105 to $95” … Read More

Our October ’26 Dollar Rupee Quarterly Forecast is now available. To order a PAID copy, please click here and take a trial of our service.