Tag Archives: top-stories

India & USA Industrial Growth

Indian IIP Growth

Indian IIP data for Nov-14 (+3.8% y/y) was released on 12-Jan-15. It has moved up smartly from the -4.2%. growth for Oct-14. But is that unequivocal good news? This report looks at the Indian IIP growth from a couple of other perspectives. 

India IIP YoY Growth

Growth? Or stagnation?

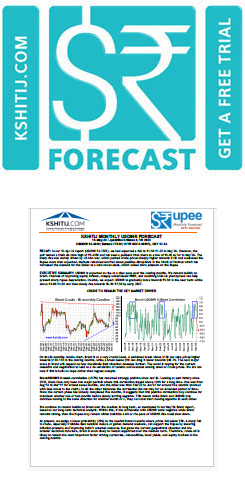
See boxes (1) and (2) in the chart alongside. For the last three years, the IIP Index has been ranging sideways between 194-163 and the annual growth rate between +6% and -4%, largely. Is this growth or stagnation?

The Index needs to rise past (3) or 180 at least if the growth rate is to move up to 5.9% at least. But (4) suggests there is trend resistance near the current levels

Further, we have to ask, even if the Industrial growth rate rises to 5.9%, is that good enough, given that India is looking to grow GDP itself at 5.9%? Industry probably needs to grow at least 8-10% if GDP growth is to move up to 5.9%. Recall, industrial growth was averaging 15-20% around 2007-08 when GDP was growing around 9%.

India & USA Industrial Growth

US growing faster than India

The chart alongside compares the industrial growth rate in India with that in the USA.

As can be seen, US grew 5.25% in Nov-14 as compared to India’s growth of 3.8%.

Further, the USA has pulled itself out of the financial crisis and growth has not dipped below even 1% since 2010. Indian industrial growth, on the other hand, has been vacillating around the 0% level since 2011.

Comparing Indian & US Industrial Growth

Seen on the same scale, (1) India averaged 15-20% in 2007-08, far outpacing the US growth of around 2% at that time. (2) But, Indian growth has been trending down since then whereas (3) US growth has been trending up.

Given that the US Industrial base is around 6 times that of India’s, growth in India will have to be at least 6 times more than the US growth rate for India to attract huge amounts of capital.

From a domestic perspective, Indian Equities have gone up through 2014 on the hope and belief that the new Modi-government will be able to pull India out of its economic morass. While that is still a hope an belief, we have to see what rate of Industrial growth is already priced into the current level of the Sensex/ Nifty.

We would assume that the Equity market is pricing in around 10% industrial growth. Unless the IIP picks up strongly in the next few months, the markets could start coming off.

On the other hand, if the IIP does indeed rise past 6% in the next few months, Equities could shoot up.

But, while the market has moved up on hope so far, further rise from here will have to be backed by performance. That could be a tall order, going by what the numbers suggest at the moment and considering the growth slowdown dogging the global economy.

Slow Growth

Investing – Where do we want to be right – Short Term or Long Term?

We invest to make profits, to multiply our money. Should we invest for the long term or for the short term? Would we want our investment decisions to be correct over the long term or in the short term?

Let us consider three cases.

Case 1 – Linear Growth

Let us consider a very simplistic case of linear growth over a period of time. If we consider a constant growth of Rs. 4 p.a. on a capital value of Rs. 100/-, we see that the graph is rising in a straight line at an angle of 45 degrees. Given the constant growth of Rs 4/- p.a. we get a return of 12% over a period of 3 years.

Linear GrowthCompared to this, the short term returns are 4% for the first year (being 104/100), 3.84% for the second year (being 108/104) and 3.70% for the third year (112/108).

This shows that staying invested over 3 years gives a total return of Rs 12/- or 12%, whereas staying invested for periods of 1 year only would give returns of Rs 4/- p.a. at a decreasing rate of return. A larger return on capital is obtained simply by virtue of remaining invested over a longer period of time, even though annual year-on-year growth is seen to be flagging with the passage of time.

Case 2 – Natural Growth Cycles

Natural Growth

Linear growth (blue line in the chart above) is not the way growth occurs in nature or in the business world. The Red Curve above is more in line with natural growth. This Red Curve can also be depicted by the Black Curve in the graph above.

Slow Growth

All plants, animals, humans and even companies grow in the manner depicted by the Black Curve, in three phases. In the first phase growth is slow in the early years (November 98 to March 03) followed by a sharp rise in growth in the second phase (between March 03 to July 07). Thereafter we notice a slowdown in the growth rate in the third phase in the later years.

Why does this happen?

  1. Initially a company takes to build its products and internal efficiencies. Capabilities are developed over time which bears fruits gradually.
  2. In the second phase, the company grows more rapidly as it builds a brand name and creates a market for its products/services to reach out to the consumers.
  3. In the third phase, growth slows down and follows a horizontal line over the later years as the old products become mature and the market gets saturated. The flat and steady growth continues till a point fresh product innovation takes place to foster a new growth phase.

Given that most businesses follow the growth path described above, it follows that an investor would want to buy into a young business and hold his investment through the early years of Growth Phase 1 so that he gets handsome returns in Growth Phase 2. It would be self defeating for an investor to exit the investment within just a couple of years after inception in frustration and impatience about the initially low returns. Investing in the business might appear to be a wrong decision in the short term, but it can appear to be a very wise decision in the long term.

This example shows that it is better to focus on being correct in the longer term.

Case 3 – Short-term fluctuations around long-term trend

Short Term Fluctuations

Breaking the long term chart into multiple small terms, we see that the price movement is volatile in the short term.

Ideally, profits could be maximized by buying at all the LOWs of the short-term chart and selling at all the HIGHs for every price fluctuation in the short-term. However, it is in a paradox in the investing and trading world that most people end up buying at the HIGHs and selling at LOWs.

The key to investing success is to notice that underlying all the short term fluctuations is a long term uptrend. That is the trend one should try to focus on. One should stay invested for the long-term instead of trying to buy low/ sell high along the short-term trend. The greatest danger with trying to be right in the short-term is that very often we tend to miss the woods for the trees. It may appear that, compared to some other people, one may have missed the opportunity to buy low/ sell high, but it is better to make that short-term trend rather than making the bigger mistake of missing the longer term trend.