


Investing - Where do we want to be right - Short Term or Long Term?
Aug, 27, 2013 By Vikram Murarka 0 comments



We invest to make profits, to multiply our money. Should we invest for the long term or for the short term? Would we want our investment decisions to be correct over the long term or in the short term?
Let us consider three cases.
Case 1 - Linear Growth
Let us consider a very simplistic case of linear growth over a period of time. If we consider a constant growth of Rs. 4 p.a. on a capital value of Rs. 100/-, we see that the graph is rising in a straight line at an angle of 45 degrees. Given the constant growth of Rs 4/- p.a. we get a return of 12% over a period of 3 years.
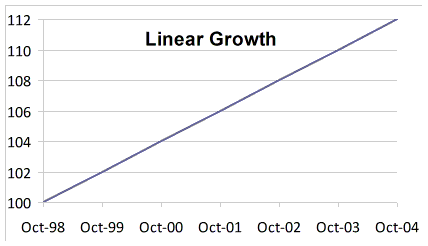 Compared to this, the short term returns are 4% for the first year (being 104/100), 3.84% for the second year (being 108/104) and 3.70% for the third year (112/108).
This shows that staying invested over 3 years gives a total return of Rs 12/- or 12%, whereas staying invested for periods of 1 year only would give returns of Rs 4/- p.a. at a decreasing rate of return. A larger return on capital is obtained simply by virtue of remaining invested over a longer period of time, even though annual year-on-year growth is seen to be flagging with the passage of time.
Case 2 - Natural Growth Cycles

Linear growth (blue line in the chart above) is not the way growth occurs in nature or in the business world. The Red Curve above is more in line with natural growth. This Red Curve can also be depicted by the Black Curve in the graph above.
All plants, animals, humans and even companies grow in the manner depicted by the Black Curve, in three phases. In the first phase growth is slow in the early years (November 98 to March 03) followed by a sharp rise in growth in the second phase (between March 03 to July 07). Thereafter we notice a slowdown in the growth rate in the third phase in the later years.
Why does this happen?
- Initially a company takes to build its products and internal efficiencies. Capabilities are developed over time which bears fruits gradually.
- In the second phase, the company grows more rapidly as it builds a brand name and creates a market for its products/services to reach out to the consumers.
- In the third phase, growth slows down and follows a horizontal line over the later years as the old products become mature and the market gets saturated. The flat and steady growth continues till a point fresh product innovation takes place to foster a new growth phase.
Given that most businesses follow the growth path described above, it follows that an investor would want to buy into a young business and hold his investment through the early years of Growth Phase 1 so that he gets handsome returns in Growth Phase 2. It would be self defeating for an investor to exit the investment within just a couple of years after inception in frustration and impatience about the initially low returns. Investing in the business might appear to be a wrong decision in the short term, but it can appear to be a very wise decision in the long term.
This example shows that it is better to focus on being correct in the longer term.
Case 3 - Short-term fluctuations around long-term trend
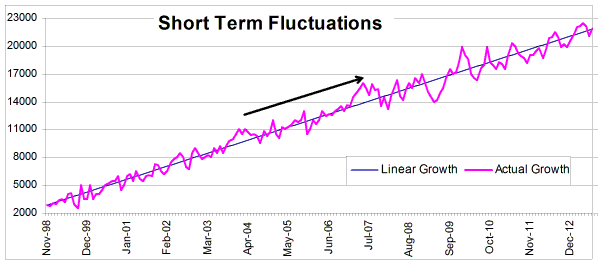
Breaking the long term chart into multiple small terms, we see that the price movement is volatile in the short term.
Ideally, profits could be maximized by buying at all the LOWs of the short-term chart and selling at all the HIGHs for every price fluctuation in the short-term. However, it is in a paradox in the investing and trading world that most people end up buying at the HIGHs and selling at LOWs.
The key to investing success is to notice that underlying all the short term fluctuations is a long term uptrend. That is the trend one should try to focus on. One should stay invested for the long-term instead of trying to buy low/ sell high along the short-term trend. The greatest danger with trying to be right in the short-term is that very often we tend to miss the woods for the trees. It may appear that, compared to some other people, one may have missed the opportunity to buy low/ sell high, but it is better to make that short-term trend rather than making the bigger mistake of missing the longer term trend.

You may also like:



In our 10-Dec-25 report (USDJPY 156.70), we expected the USDJPY to trade within 154-158 region till Jan’26 before eventually rising in the long run. In line with our view, the pair limited the downside to … Read More
Our last report (03-Oct-26, UST10Y 5.28%) warned of increased chances of Brent rising towards $135-145, US Core PCE rising towards 4.5-5.0% and the US10Yr rising towards 5.80% (Dec-26) and 6.00% (Aug-27). While Brent has risen to nearly $117 and the Core PCE (Aug-27) has inched up to 3.01%, we find that US Yields have fallen across …. Read More
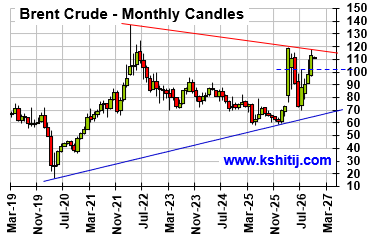
In our October 2026 report (5-Oct-26, Brent @ $101.71), we had stated Brent would be structurally bullish for the long term based on the technical analysis, within which a test of $115 was expected in Oct-26, followed by a test of $134 by Dec-26 and eventually targeting $145 in 2027. In line with our expectation, Brent did test $117.45, slightly higher than our expected $115 in Oct-26. … Read More
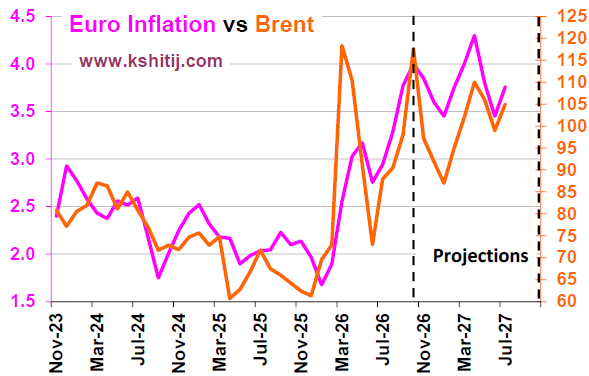
In our October 2026 report (9-Oct-26, EURUSD 1.1250), we revised our Euro forecast downwards on a decline below 1.13 and expected a fall towards 1.10-1.0875 by the next year. Rising crude prices were a concern and were expected to raise the US and Euro yields further, along with the inflation figures. The Euro has been declining while below 1.13 and has tested
1.11 so far. Both the ECB and the FED kept policy rates unchanged in the Oct-26 meeting, while the markets expect a rate hike in the Dec-26 meeting by both central banks. …. Read More
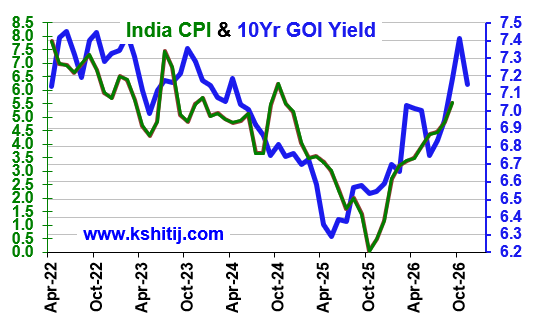
In our 06-Oct-26 report (10Yr GOI 7.19%%), we examined the possibility of the RBI not raising the Repo rate, even though 91% of the market expected it to raise. We were barking up the wrong tree as the RBI did indeed raise the Repo on 07-Oct. Thankfully, our forecasted rise in Brent to $115-120 did materialize well with Brent touching a high of $118 on 30-Oct. We also forecasted that … Read More

Our November ’26 Dollar Rupee Monthly Forecast is now available. To order a PAID copy, please click here and take a trial of our service.