

Aussie Long term Forecast - Jun'17
Jun, 10, 2017 By Vikram Murarka 0 comments

10-June-17 / AUDUSD 0.7523/ Copper 2.6445 / USDCAD 1.3470
Recap:
In the May report we had moderated our bullish view and stated a possibility of seeing a medium term bottom at 0.73 preceding the bullish reversal towards 0.80. In line with what we said, May saw a low of 0.7325 from where Aussie has been moving up. But a confirmed break above 0.7750-0.7800 is needed to initiate further bullishness towards 0.80 and beyond.
EXECUTIVE SUMMARY:
Our bullish stance for Aussie remains intact while we wait for confirmation on a break above major resistance area of 0.7750-0.7850. Sideways consolidation below the mentioned resistance levels could continue for another couple of months before any actual breakout takes place. Overall we prefer Aussie bullishness in the longer run.
Copper
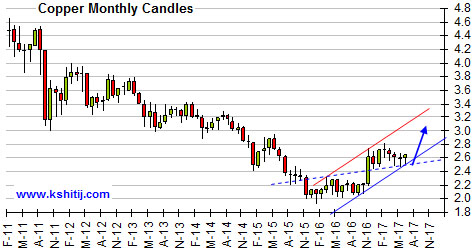 Copper started rising since Nov’16 after the sideways consolidation below 2.40 for almost a year from Nov’15 to Oct’16. Thereafter the short term channel uptrend has been holding well with a possibility of 2.50 being an immediate bottom for the coming months.
Taking into consideration that 2.50 would be a bottom for at least the next few months, we may expect a sharp rise towards 2.80-3.00 in the next 2-3 months.
USDCAD
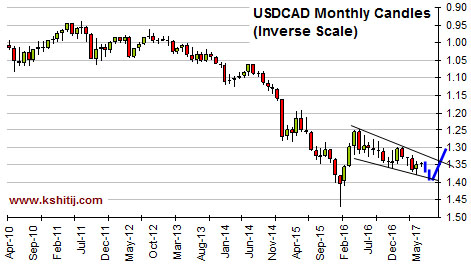 The USDCAD monthly chart alongside is shown on an inverted scale to easily identify its inverse correlation with AUDUSD.
USDCAD is trading in a downward channel and could be ranged within the 1.36-1.39 region for the next 2-months followed by a sharp breakout on the upside. A possible downward wedge-formation is expected and if it turns out correct, it could push the currency pair towards 1.30 or even higher in the next 5-6 months.
Aussie and Canadian Dollar, both being commodity currencies, follow Copper closely and are positively correlated with each other. As mentioned above if Copper holds above 2.50 and moves up, it could lead to strength in the Aussie and Canadian Dollar (against the US Dollar) also along with itself.
While both Copper and the Canadian Dollar indicate a possible upmove for the longer run, we prefer bullishness for the Aussie in the longer term unless any reversal signal is visible in the price action.
Aussie Monthly Chart
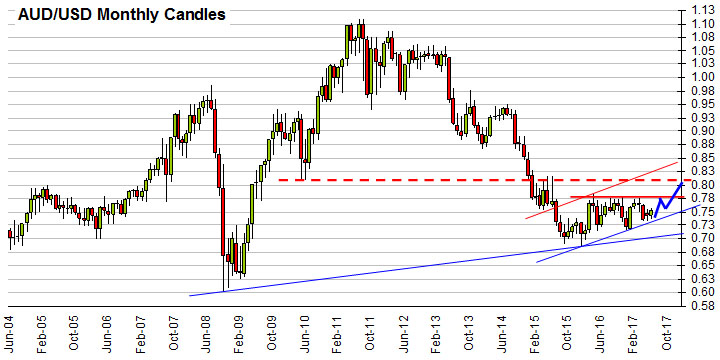
The chart above clearly shows higher lows in price action from the bottom of 0.6827 seen in Jan’16 and if it continues, we could see a rise in Aussie in the coming months. As mentioned in our previous report, 0.78 is an important near term resistance which could get tested in June-July before possibly breaking on the upside targeting 0.80 within Sep-Oct’17.
Looking at the current scenario there could be a ranged phase for the next couple of months within the 0.78-0.74 region before a final breakout on the upside. The bullish views in Copper and USDCAD mentioned earlier are also supportive of this view.
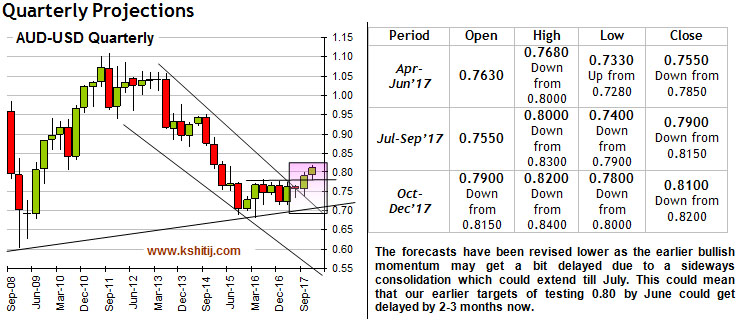
Quarterly Projections

You may also like:


In our last report (27-Feb-26, UST10Yr 4.01%), which was published just one day before the start of the US-Israel-Iran War on 28-Feb, we had continued to target 4.60% on the US10Yr based on expectations of higher Crude. At that time, we were looking for Brent to rise …. Read More

The escalation of war between US and Iran throughout March-26 has led to a rally in Brent prices to as high as $119.50, exceeding our bullish targets by a large margin, much ahead of expected time. Will it remain bullish for the coming years?… Read More

Our view of a fall towards 1.14 seems to be playing out well so far as the tensions in the Middle East and the US-Iran conflict have triggered a rise in Dollar Index and crude oil prices, thereby weakening to Euro to 1.1507 so far in Mar-26. Will it again attempt to rise targeting 1.20? Or will it remain below 1.19/20 now and see an eventual decline to 1.10? …. Read More
In our 09-Mar-26 report (10Yr GOI 6.69%) we had warned that the sharp rise in crude due to the US-Iran conflict could push Brent toward $134, which would lift CPI toward ~6.2%, eliminating any chance of RBI easing, and potentially force tightening. This inflation shock, along with higher US yields, was expected to push the 10Yr GOI up to … Read More

In our 10-Dec-25 report (USDJPY 156.70), we expected the USDJPY to trade within 154-158 region till Jan’26 before eventually rising in the long run. In line with our view, the pair limited the downside to … Read More

Our March ’26 Dollar Rupee Monthly Forecast is now available. To order a PAID copy, please click here and take a trial of our service.