Chief Currency Strategist at KSHITIJ.COM. Likes to look at the markets from many different angles. Weaves many conventional and unconventional technical analysis techniques and fundamental analysis into a global macro perspective. Likes to take the road less traveled.
As the origin of the word itself suggests, Economics has concerned itself with the distribution of limited resources. The evolution of Economic theory has reflected the evolution of the human economic experience over time of what limited resources means.
Given that after the Greek and Roman eras, Western thought emerged only in the Renaissance after the struggles for survival through the Dark Ages and bloody wars through the Middle Ages, it is no surprise that the Western philosophers took a rather dim view of the world. So we have Thomas Hobbes (1588–1679) calling life “nasty, brutish, and short”. Quite understandably, therefore, the worldview of the Classical economists was centered on the concept of limited resources. Hence the choice of the word “economics”.
In contrast, India, the land of milk and honey since as far back as human history goes, never experienced any material shortages before the white man came in. However, that is a different line of thought and I should not digress so early in my ramblings.
Coming back, the central concept of limited resources was reflected in the inflexible and vertical Long Run Aggregate Supply (LRAS) curve of the Classical Economists. With time, theory evolved to the point where Keynes depicted the AS (aggregate supply curve) as horizontal at lower levels of GDP before it curved up to become vertical at higher levels of GDP. This small video from Khan Academy is a nice primer on this. With this, there were two important transitions in economic thought that happened. Firstly, with the change in the shape of the AS curve, the productive capacity (or AS) was no longer seen as a major limiting factor on the economy. Secondly, the focus shifted, instead, to AD (aggregate demand) being seen as a limiting factor on the economy. Today, with a globalised economy and globalised supply chains, if anything, the developed world (certainly) finds itself dealing with the problem of more than ample supplies and less than adequate demand.
Keynes onwards, it is the non-availability of Money (as a means of exchange), that has been seen as the factor that constrains demand. No money, can’t spend. So, in the beginning, the government was allowed to run a deficit. Later, the Gold Standard was abandoned by Nixon in 1970 and the USA was free to print as many Dollars as it wanted, unencumbered by any obligation to moor the Dollar to its Gold reserves. While there might be a tendency to baulk at this, we have to concede that these two developments have been crucially vital enablers for the post-War global economic growth and for the post-1970s globalization which has helped billions to come out of poverty, a process that still continues.
More recently, only the most churlish will refuse to admit that had Helicopter Ben not invented QE (quantitative easing) and had Draghi not done “what it takes” after the Great Financial Crisis of 2008 and the European Crisis soon after, the developed world would have had to go “back to the future” to the Great Depression. These two keen students of Keenes (oops, Keynes) freed central banks from the obligation to link money supply to any fiscal considerations.
Today, with the advent of the coronavirus crisis, the world is willing to run up huge deficits in order to send cheques to everyone as everyone is being forced to work from home as country after country and economy after economy goes into lockdown. Western thought has come a long way from the time when Marie Antoinette said “If they don’t have bread, let them eat cake” to the time today when Trump is willing to say “Let us give them bread (cash) so that they can eat cake”.
Welcome to the emerging world of Modern Monetary Theory (MMT) which cites Japan as an example and says there is no reason why governments cannot run deficits that are several times the size of their GDPs. Listen to Stephanie Kelton, one of the champions of MMT, explain this theory. Notice that inflation is no longer a monster to be scared of. Supply not being a constraint, Demand-Push Inflation is dead. Further, with Crude now likely to stay well below $70 for some years ahead and to be eventually replaced by solar power, Cost-Push Inflation may also be a demon that might get slain. In this environment, when government bond yields are headed towards zero and are likely to stay there for years together, why should not governments run unlimited deficits?
There are merits to this evolution of thought that says non-availability of money should not be allowed to constrain demand. If governments do not have money, they can run deficits. If central governments need to expand money supply, they may simply create. Human population has grown and everyone is seen to have a right to not only the minimum of roti-kapda-makan, but also to education, holidays, smartphones and Netflix. Is there any philosopher or politician anywhere in the world with the gumption to deny this? If people do not have money, they should be given money. Today the daily wage earner (whether in the United States or in Uttar Pradesh) should be given money due to the coronavirus. Tomorrow it will be given as a part of Universal Basic Income. At no point of time should peoples’ demand be curtailed and the wheels of commerce should not grind to a halt due to the non-availability of money.
Or, how India/RBI’s policy of weakening the Rupee to promote Exports does not work and can actually harm Investments, Exports and Growth.
Also, the global markets are presenting us with a unique opportunity. We should take it.
26-Jun-20, USDNR @ 75.63
Executive Summary
India/RBI has long followed a policy of weakening the Rupee, ostensibly in an attempt to promote Indian exports and thereby reduce the country’s chronic trade deficit (hereinafter referred to as “the policy”). [Ref I, II].
Several studies have conceded that a weakening currency does very little to promote exports growth, yet we persist with the policy. Alarmingly, not only has this policy not delivered export growth, it now threatens to severely damage India’s ability to raise foreign capital that is so vital for the massive investments that the country needs.
Further, since August 2019, the RBI is actively creating a one-way-street in the forex market, where only Rupee depreciation is allowed, not Rupee appreciation. This can have disastrous results in that, if pushed beyond a point (which is very close by), the Rupee could weaken by 126% over the next decade. The situation is dire and there is very little room for policy error here. The RBI would do well to forthwith abandon its old policy of weakening the Rupee in a one-way manner and leave the exchange rate to its own devices, else it could be courting disastrous consequences.
Ironically, the global market conditions are currently presenting India with a unique never-again opportunity to enter into a virtuous cycle of strong/ stable currency – higher investments – higher exports – higher growth, all with lower inflation and lower interest rates. This can either be capitalized on by leaving the exchange rate alone, or it can be frittered away by engineering perpetual Rupee weakness, with disastrous consequences.
IV. Rupee weakness can impede Investments – warning from the Sensex V. Impairing the market’s shock absorbing capacity
Section C: The Future Outlook
VI. Opportunity presenting itself – should be capitalized on VII. A bright future is possible. Please do not commit Hara-kiri. VIII. Progression or Regression – two possibilities
APPENDIX: China and Japan: Currency and Exports have weak correlation References and Data Sources
Ref I. Yin-Wong Cheung and Rajeswari Sengupta: It is perceived that the Reserve Bank of India adopts an asymmetric intervention policy that stems a currency appreciation whereas allows a reasonable amount of depreciation.
Ref II C. Rangarajan & R. Kannan: The stated policy of the Reserve Bank is that it has no specific target and that it intervenes only to reduce volatility. This is only partially true.
SECTION A – EVIDENCE REFUTES POLICY
I. FX Rate does not influence Exports, nor does it impact Imports
Contrary to popular belief that a weakening currency leads to exports growth, data and research [Ref I, III] show that this is not so. Rather, the opposite correlation seems to hold truer in India since 2000.
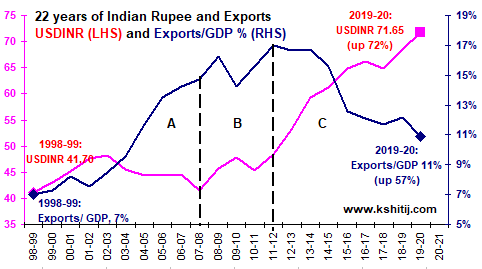
Fig 1: 22 years of USDINR and Exports/ GDP
The USDINR (left axis) has weakened 72% from 41.70 in 1998-99 to 71.65 (average) in 2019-20.
In this period, Exports/ GDP (right axis) has risen only 57% from 7% in 1998-99 to 11% in 2019-20. This period can be divided into sub-periods A, B and C. Periods A and C show that the policy in question does not work.These are examined below.
Table 1: USDINR and Exports/GDP movement in India
It is only in Period B (a short interlude of 3 years from 2008 to 2011) that the theory seems to work. In the longer timeframe of Period A (8 years) and Period C (9 years), export performance is actually seen to be contrary to what might be expected if the theory were correct.
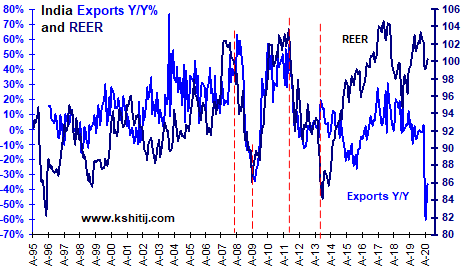
Fig 2: REER also does not work
India’s annual Exports growth (left axis) showed steady improvement since 1996, more so after 2000. During the period, the Real Effective Exchange Rate (REER, right axis) went from an undervalued level of 82 to an overvalued level of 102. Later, even as the REER became undervalued, exports fell and again thereafter, even though the REER became overvalued, exports rose. If anything, the REER and Exports correlation is opposite to that expected as per theory. [Ref I]
Ref I. Yin-Wong Cheung and Rajeswari Sengupta: …starting from 1993-94 onwards, the expected relationship seems to have been reversed… Indian exports grew rapidly since 2000 despite the REER appreciation…
Ref III. Spyros Roukanas, Persefoni Polychronidou, Anastasios Karasavvoglou: Statistical data on real effective exchange rate and aggregated data of Serbian exports indicate that the ambience of overvalued national currency did not harm export performance.
One might think that perhaps the exchange rate policy is expected to curb the trade deficit by curbing Imports. After all, a stronger Rupee (2001-08) was accompanied by higher Imports and later a weaker Rupee (2011-20) saw a fall in Imports. However, this behaviour of Imports is because it has a symbiotic relationship with Exports, as seen below.[IV]
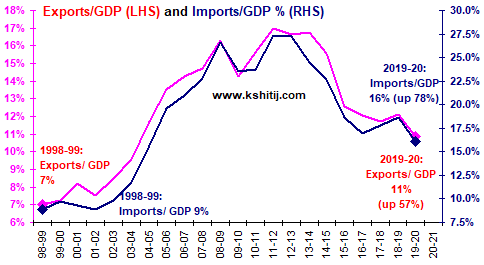
Fig 3. Exports and Imports move together
Exports and Imports move up and down together closely. This is because (a) over the years, the import content of India’s exports has risen and (b) both exports and imports are impacted more by the global trade climate than by the exchange rate.[Ref II]
This relationship between export-import is observed in China and Japan also.
Fig 4. Exports and Imports move with Brent prices
We just saw how Exports and Imports move together. Here, we see that, As might be expected, India’s Imports and Brent Crude prices increase/ decrease together.
Therefore, India’s Exports, Imports and Brent Crude prices all move together.
This is because Crude prices can be taken as a barometer of global trade and GDP growth and it is this which impacts Indian exports/ imports more rather than the Dollar-Rupee exchange rate. [Ref II]
From the evidence so far, we can surmise that the policy of weakening the Rupee to promote Indian exports and narrow the trade deficit has not worked.
Ref II: C. Rangarajan & R. Kannan: The import content of India’s exports has risen from 9.4% in 1995 to 24% in 2011; we find that World Exports has a more powerful effect in influencing exports than REER. World Exports account for 83% of the variability as against 17% of REER
II. Exports respond to Investments, rather than to the Rupee
It is well known that Exports are positively impacted by investments in infrastructure (ports, roads, power et al) and production capacities (large scale factories), because these go much further in enhancing a country’s export competitiveness in the world market rather than a weakening currency. The data bears this out.
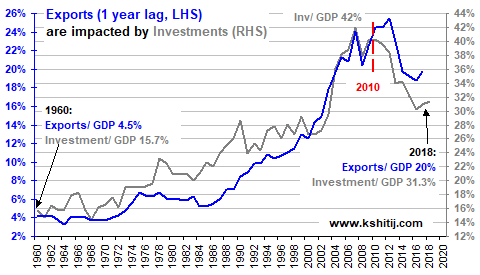
Fig 5. Exports are related to Investments
As Investment/ GDP grew from 15.7% in 1960 to 42% in 2007, Exports/ GDP also rose from 4.5% to 21%.
In this period also, investments grew faster from 1984 to 2007 as compared to earlier, and exports also picked up speed in line with investments.
After 2010, the Inv/GDP ratio fell to 31.3% and along with it, Exports/ GDP also fell to 20%.
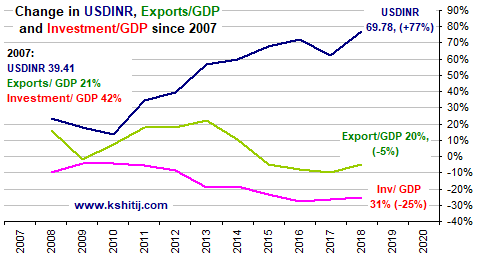
Fig 6. Rupee weakened 77%, yet Exports fell 5%
This chart zooms into the period after 2007.
We find that by 2018, the Rupee had weakened 77% compared to 2007. Yet, in this period, Exports fell by 5%. This again clearly shows that the exchange rate has no impact on Exports.
Rather, Exports fell in line with the 25% decline in the Investment/ GDP ratio.
Exports competitiveness and growth in the world market is a complex thing. It depends on a number of factors including infrastructure, quality, global demand, marketing, research and development, enabling legal system, labour productivity, economies of scale and so on. It is simplistic to think that Export growth can be increased by weakening the currency. If anything, it is better to aim to promote Investments as a means to achieve Exports growth. [Ref II]
We should be warned that weakening the Rupee in pursuit of an empty theory can jeopardize Investments, the single most important factor contributing to higher exports and GDP growth. The exchange rate may be left to its own devices.
Ref II: C. Rangarajan & R. Kannan: Truly speaking, the critical factor is not so much exchange rate as competitiveness… the exchange rate variable represents more than the pure exchange rate. It really stands for the degree of competitiveness of Indian exports… The crucial factor is not so much exchange rate as competitiveness. The whole gamut of policy measures government introduces from time to time are aimed at this objective. We have not been able to take into account explicitly this factor. Exchange rate is one element in this basket of measures.” [Author’s observation: inability to measure the competitiveness of Exports and positioning the exchange rate as a proxy for it is leading to a grave policy error, which should be stopped forthwith].
III. IIP and FX Reserves – another albatross around the Rupee’s next
Another argument put forth to support the policy of weakening the Rupee is that the RBI needs to build its FX Reserves as a counterbalance to India’s Net International Investment Position.
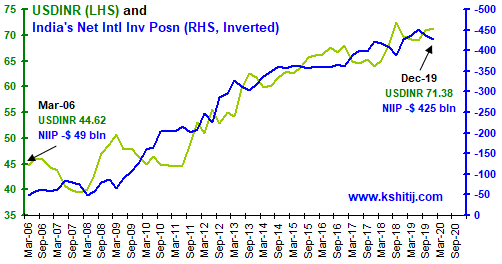
Fig 7.Weakening the Rupee with NIIP
India’s NetInternational Investment Position (NIIP, right hand axis, inverted) has “deteriorated” since 2008 as India’s economy has been increasingly opened to international capital flows. As can be seen, the Rupee has weakened alongside.
In a manner, a deteriorating NIIP can be seen as a “risk” and a cause for concern. However, it is a given that the NIIP will continue to “deteriorate” over time, as India’s need for foreign capital will only keep on increasing and that FX Reserves will never catch up or limit the growth of the NIIP. If the RBI continues to buy Dollars to increase FX Reserves “war chest”, then the Rupee can weaken into perpetuity.
Increased Dollar buying since Aug-2019. Why?
The RBI has significantly increased its Dollar purchases since August 2019 [See Section B-V], forcibly preventing Rupee gains even in the face of robust capital inflows. While RBI purchasing Dollars is not new, what we now see is that the RBI is intervening not to smoothen out volatility but to actively prevent Rupee appreciation. This is a new phenomenon and seems to be somehow linked to the adoption of the new Economic Capital Framework (ECF) after Aug-2019, although we do not clearly understand how and why.
FX Reserves form 73% of the RBI’s balance sheet. To quote from the August 2019 report of the Expert Committee to review the extant ECF, “… the RBI suffers losses when the rupee appreciates against the USD and/ or the other currencies in its forex portfolio and it gains when the rupee depreciates against them.Thus, counter-intuitively, the RBI suffers valuation losses during times when the economy is witnessing strong growth and large capital inflows which normally are associated with rupee appreciation.”
The accumulated revaluation profits over the years makes up the Revaluation Reserves of the RBI. By including this in the Contingent Risk Buffer (CRB) of the RBI, the CRB stood at 26.8% of the RBI’s balance sheet (on 30-Jun-18), well in excess of the 6.5% level recommended to meet various risks faced by the RBI. Excluding the Revaluation Reserves, the CRB stood at 7.2%, still in excess of recommended 6.5%.
The Expert Committee to review the extant ECF has recommended that the Revaluation Reserves should be retained with the RBI and should not be alternatively deployed or distributed (say by way of dividend to the Government). It is perplexing then, as to why the RBI is continuing to increase its Reserves.
The only explanation seems to be that apart from the possibility that it wants to avoid revaluation losses due to Rupee appreciation (?), it also seems that it is acutely sensitive to “financial stability risks”, especially after the GFC. In the words of the Expert Committee, “financial stability risks are those rarest of the rare, fat tail risks whose likelihood can never be ruled out and whose impact can be potentially devastating.”
The question that arises is, could the dogged building up of Reserves as a foil against such risks actually end up inviting the far away risk closer, so close that it actually materializes? The danger is that Rupee weakness beyond ………
Those include global currencies (Euro, EM Currencies etc), equities (Dow Jones, MSCI EM indices etc), commodities (Gold, copper, oil etc), bonds (US Treasury, TED Spread etc) and fundamental data.
Correlation studies and inter-market relationships also form a major part of our analysis.
The extensive study we do on all these factors helps us gauge where the Rupee is going, but we don’t stop here. We also record all our forecasts and conduct performance reviews in order to make continuous improvements and minimize errors in what we do.
Over the years, many of our clients have asked us why, when we publish forecasts, sometimes we predict the direction of the movement correctly, the timing of our prediction is incorrect.
Here, we wish to provide some clarity in that regard.
Some of the basic tools that we at Kshitij use in our charts for our analysis are: 1. Trendlines 2. Candles 3. Moving Averages 4. Line Charts Most of our charts are very simple with only the above mentioned basic tools. We do not use many oscillators or momentum indicators either.
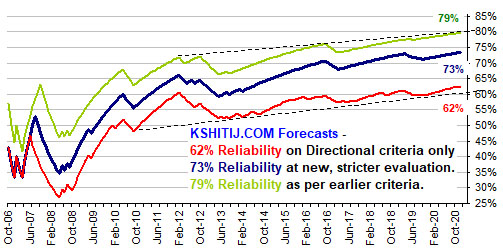
Through our currency forecasts and hedging strategies, we like to think that we provide a sense of reliability to our clients. This is most manifest in the 14-year track record of our Dollar-Rupee forecasts, the first, and to our knowledge, still the only one of its kind in India, which proves in real, verifiable numbers, a reliability of 74%.
Rupee Forecasting – Advanced Techniques – The KSHITIJ Way
To see where the Indian Rupee is going we look at 50 factors. Yes, you read it right, 50 factors. Those include global currencies (Euro, EM Currencies etc), equities (Dow Jones, MSCI EM indices etc), commodities (Gold, copper, oil etc), bonds (US Treasury, TED Spread etc) and fundamental data. Correlation studies and inter-market relationships also form a major part of our analysis. The extensive study we do on all these factors helps us gauge where the Rupee is going, but we don’t stop here. We also record all our forecasts and conduct performance reviews in order to make continuous improvements and minimize errors in what we do.
Even in today’s Brave New World, many people still believe that currencies cannot be forecasted and many forex hedgers believe that forecasting the currency movement is not part of their job.
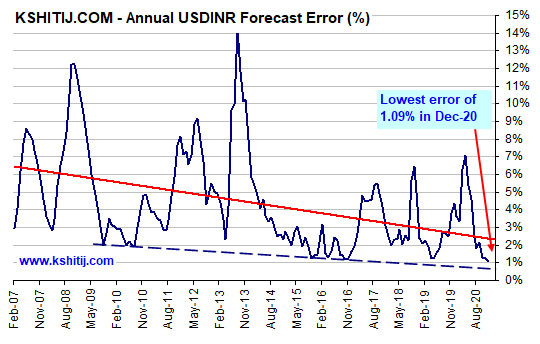
In fact, at 1.09%, our Dec-20 forecast error for Dollar-Rupee is the lowest we’ve had in the last 14+ years.
Here we share with you how we think forecasting currency movements can be mastered.
Believe. Then you can make it happen.
You have to first believe that currency forecasting is possible. If we think forecasting is not possible or that trying to figure out where the market will go is a mug’s game, then we are never going to become good at forecasting. Let me make it easy for you right at this stage. 100% accuracy in forecasting is neither needed, nor is it possible. When we make forecasts, we are also going to make mistakes. That is part of the game. A strike rate greater than 60% or “Reliability” greater than 60% is good enough to make you a winner; and then of course we can aim to increase the reliability towards 70% or 80%.
Making mistakes. And the kinds of mistakes
While mistakes are part of the game, aiming for better forecasts is nothing other than aiming to reduce mistakes. Greater reliability comes from reducing mistakes. More mistakes, less reliability. Less mistakes, more reliability.
Where do mistakes come from? How do we reduce them? Mistakes come from (a) inexperience (b) negligence (c) our biases (d) errors of judgement and finally (e) surprises.
Mistakes that arise from (A) inexperience are generally reduced with time, with experience. Mistakes arising from (B) sheer negligence are rightfully reduced through punishment by the markets, by incurring losses. No one is immune from this. Thankfully, the market is both ruthless in meting out punishment and unhesitating in handing out rewards. Reducing mistakes from inexperience and negligence can get us up to 40% reliability. Working on (C ) our biases, can help us get ourselves up to 50-55%.
The first two are the easiest to achieve. And working on our biases is also relatively easy, as we will show how later on.
Working on (D) errors of judgement is much more difficult. To the extent we can reduce them, we can move from 55% to 70%. Finally, the last 30% bit due to (E) surprises is something we can only hope to reduce but may never fully escape. That said, if we get our reliability up to 80%, we will be super-forecasters in any case. How can we work on (C ) our biases and (D) errors of judgement?
Reducing biases and errors of judgement
Look at long histories
When looking at charts, look at long histories. The longer the history, the better. Many people base their forecasts on just whatever chart is available in front of them. In his book, “Thinking, Fast and Slow” Daniel Kahneman has termed this as the WYSIATI Bias, or the What-You-See-Is-All-There-Is bias. It says that most people tend to arrive at conclusion by looking at whatever limited data or evidence is present in front of them, instead of looking for more and more data or evidence before drawing up a conclusion.
We regularly look at monthly, bi-monthly and quarterly charts, even yearly charts; and we ideally we would like to go back 40-50-60 years at least. The longer the history, the better we can identify longer term trends and patterns and can therefore better understand the context of the current price movement.
Look for correlations among different market variables. You would be surprised how, many a times, we get clues about the variable we want to track from the chart of a different variable! Having figured that, use the correlation to work backwards to the desired variable. Common examples are the need to study the Dow Jones to figure out the Sensex or the Nifty, and to study the Dollar Index and Euro to figure out Dollar-Rupee. There can be many more. It is interesting to keep an eye open for possible correlations.
Ratio Charts are a must
Besides studying the correlation charts between variables, it is imperative to study the ratio charts between variables. If the Euro-Dollar is expected to hit level X and the Euro-Rupee ratio chart is likely to hit level Y, then a simple Y/X division will give us a projection for Dollar-Rupee. People have scoffed at us for doing things like these, but we know that it has helped us improve. How? When we do this exercise across a number of different variables, it gives us a rather reliable average for a possible Dollar-Rupee rate, because each ratio relationship acts as a check upon on all the others. If they are all converging within a relatively narrow range, that is good and reliable. If any of the ratio studies throws up a projection that seems to be far from the average, it alerts us to the possibility of a mistake in our chart reading, or that perhaps some deep-seated bias is rearing its head and needs to be nipped in the bud.
Do not restrict to only one technique
When studying the charts, we do not restrict ourselves to only one technique of technical analysis. We use classical charting using trendlines. We use Moving Averages; and we also use Elliot Waves. As in case of looking at many variables, the thought process behind employing two-three different techniques is that if the inferences from a number of techniques converge on the same conclusion, we can assume that to be more reliable.
Are we overdoing it?
Why do we look at long histories, many time frames, correlations, ratios and why do we use three different techniques? Sherlock Holmes puts together many different pieces of evidence, brings in knowledge of many disciplines and sciences and is never in a hurry to jump to a conclusion. This, despite having a super-sharp brain and legendary abilities of observation and discernment. Why does he put in so much of hard work? He is not operating in the 50% correct zone. He does all this just to check, check and re-check to make sure that he does not allow any of his biases to come in the way and to avoid errors of judgement. All our studies are also aimed at avoiding these mistakes.
How about doing some things the books don’t tell you to do
Many, if not all, of the foregoing techniques might be known to a lot of people, whether or not they use all of them. Here are some “new” things that we have been doing to help us increase the reliability of our forecasts.
a) Look at the Time Axis
Most of the time, or truly speaking almost all the time, people look at only the Price-axis or the Y-axis of a chart and spend almost zero time on looking at the Time-axis or the X-axis. In other words, most of the time people are only trying to forecast the Trend and the Target of a currency. We have to try and figure out how much time will be taken to reach the forecasted price levels, otherwise the forecast is not very meaningful. In order to get an idea of Time, we have to, obviously look at the X-axis (time) also. Although looking at the X-axis and forming an idea about Time takes effort, practice, and quite frankly it takes time, it is imperative to develop this ability. It is also very useful in meaningful cross-market analysis and deriving inferences from ratio charts.
b) Look at Maths and Stats as well
Look at the simple maths and stats behind the currency movement. For example, how much does the market tend to move, on average, in 1 month? Or 3 months? We call this measure the Amplitude, which is akin, perhaps to Average True Range. It is simply the difference between the High and the Low. It is remarkable as to how much most people underestimate volatility. Tracking the Amplitude is imperative to get an idea about volatility. Make a histogram of observed amplitudes over the past history. Work out the average amplitude that can be expected. This is very useful in making price projections. There can be many more examples, but this is one of the simplest.
c) Track your performance
This cannot be overemphasized. If you want to improve, you have to start tracking your performance. Without that, there is no way you are going to make any meaningful progress. Of course, tracking your performance means bringing in discipline to note down your analysis and it calls for the guts to face the errors you have made. It is both hard work and it hurts the ego. However, do remember that error-tracking or performance measurement is the essential difference between being a hobbyist or a professional. If you are really serious about improving your forecasts, our best advice would be to start tracking your errors.
We have been diligently tracking our errors for the last 14 years. We devised our own error-tracking protocols and have kept making it tighter for ourselves over the years. This has helped us improve tremendously, such that our Dollar-Rupee Reliability has improved from 35% in 2006 to 73% in 2020.
d) Take time
Take time to make your long-term forecasts. Keep them in mind. This is very important. Do not make a forecast and forget it. If you have done your analysis carefully, there is a high chance that your forecast will be right. Have that confidence. Then see how the short-term market movements are fitting into your long-term forecasts.
e) Look left. Then right. Then left again. And then cross the road.
Make conscious effort to work out the alternate scenario with nearly as much dedication as painting your preferred scenario. Assign probabilities to these alternative scenarios using age old rules of (a) honouring trendlines, (b) “trend is your friend” and (c) figuring out the path of least resistance.
Remember, the starting working assumption in classical charting should be that a trendline will hold. Do not pre-empt the break of a trendline, unless you have ample reason to do so. Further, the trendlines on longer term charts have greater chances of holding. They deserve that respect. Remember these trendlines in your mind.
So much of hard work? For what?
After doing all this, our forecasts on Rupee, Euro and Crudeare showing a Reliability of more than 70%. You might think what is the point of undertaking all this hard work if you get a reliability of only 73%? The counter to that is, you will be confined to the 50-55% region if you do not put in this work.
Now, we have to try and figure out how to move up to 80% and past that. Ah well, who said life was supposed to become easier?
Everyone knows the Howrah Bridge of Kolkata. Not many people, not even Kolkatans barring a few, might know that there are two unique functioning swing bridges in Kolkata, leading in to the Kolkata Port.
The first one is quite close to our house, hardly 700 mtrs as the crow flies. The bridge is not attached to the road it serves, the road that leads to the venerable Bengal Nagpur Railway headquarters. It pivots on a horizontal platform constructed in the middle of the waterway. When ships are to pass into the port from the river or out from the port, it swings away from the two shores coming to rest along the length of the platform, allowing river traffic to pass on both its sides. When there are no ships to pass, the bridge swings on its pivot to almost touch both sides of the waterway, allowing road traffic to run across it. It is worth seeing.
Now, my purpose is not to share sight-seeing nuggets of Kolkata with you (although that can be quite an engaging pursuit on its own, especially given where I live on the very periphery of this fair city), but to share something more interesting.
The other Sunday, I woke up my 13-year daughter, who has recently developed an interest in photography, at around 7AM. “Hey, chalo, let’s go, it’s still the golden hour, let us get some beautiful photos.” Half-an-hour later we were at the swing bridge I just told you about. “How many of your friends have seen something like this?” I asked.
None of her friends, nor she, had seen anything like this before. The entrance to a port, ships looming large nearby, tall cranes and a bridge that swings open and close, on a clear-skied morning when the low slanting rays of the winter sun were still a mild ember. A budding photographer’s delight.
“Hey! Kaun hai? Wahan nahin jaana! Hato wahan se!” came a voice as my daughter leaned a tiny wee bit from the side of the bridge to get a better frame. I looked around. It was the CISF jawaan guarding the bridge, calling from the side of the river. I gestured to him with folded hands that everything is alright, I am there to take care of her. He relented.
Still, I ambled across to where he was to engage him in conversation, so that my daughter could continue with her photography unhindered. Fair skinned, tall, he did not appear to be Bengali. “Namaste, Sir,” I said, “Kahaan se hain aap?” He drew his height another half an inch. “Jammu se.”
My eyebrows went up, significantly more than Jeeves’ ever do. This was interesting. His name was Balbir Singh from Jammu, posted to Kolkata Port Trust for the last four years. The conversation naturally covered the situation in J&K after Article 370, and how he might be missing his paradise on earth and how it might be difficult to for him to bear the sweaty summers of steamy Kolkata.
“Aap kya karte hain?” He asked. “Mera Finance ka kaam hai,” I offered, not sure how to explain currency forecasting and hedging to a CISF jawaan guarding a swing bridge at a port. “Finance mein hain toh aap shares ke baare mein jaante hain?” he asked.
This was intriguing! “Haan, jaanta hoon,” with the ill-concealed pride of an andhon mein kaana raja.
“Main intra day trading karta hoon,” he said and went on to tell me how he trades 300 lots of Nifty and Bank Nifty and makes money in the first 15 minutes of opening and on expiry day, by following a few candlesticks.
My eyes and ears popped at the incongruity of it all. I pictured this burly Jat from Jammu sitting on his rickety chair by the port inlet, guarding an unknown swing bridge, trading in-and-out on his phone on Zerodha, while shooing off budding photographers. “Aapke paise bante hain?” I blurted, smugly thinking the guy must surely be deep in the red.
He looked at me intently for a while and then said, “Aap yeh keh sakte hain ki paise khotey nahin hain. Aur aap kaise trade karte hain?”
“Main long term karta hoon,” I replied lamely, feeling like a babe in the woods, at the same time marveling at the growing Equity Cult in India, recalling the data on all new demat accounts opened in the last couple of years. Who needs the FPIs? We have our CISF jawans defending our Indices now!
“Main aaoonga aap ke paas, long-term seekhne ke liye,” he said, all eagerness to learn a new skill. I was dumbstruck.
“Aur aap Jammu aaiyga,” he continued, “kam se kam aath din ka samay le ke. Aap jab jaayenge, main bhi chhuti le loonga. Aur Jammu-Kashmir aapko aisa ghumaoonga, kam paise mein, ki aur koi aapko kya ghumayega,” proudly conjuring visions of valleys with deep carpets of lush green grass and crisp blue skies with tufts of white clouds slowly drifting towards snow clad mountains in the distance. I found myself salivating at the prospect. I have never been to Heaven on Earth yet.
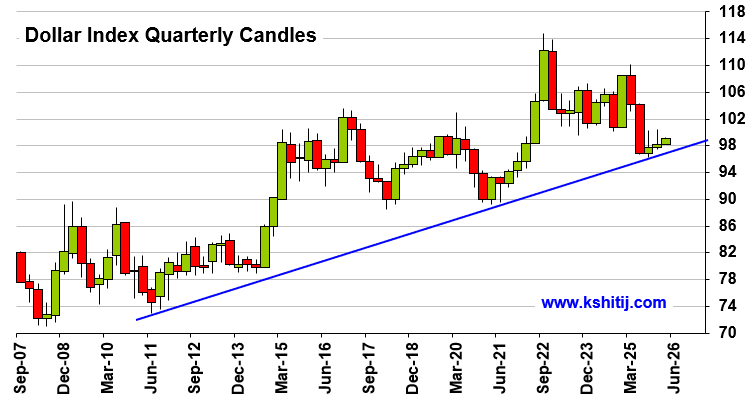
In our last report (29-Jul-26, UST10Y 4.62%) we had said there were greater chances of rate hike on 16-September; we had also called for higher Yields, targeting 4.75% on the US2Yr, 4.80% on the US5Yr and 5.00% on the US10Yr. Both the prognoses seem to be …. Read More
WHAT'S NEW?
Aug’26 Crude Oil Report
In our July 2026 report (6-Jul-26, Brent @ $71.94), we had expected Brent to test $64 before consolidating within the $64-90 range till Mar-27. Thereafter, the prices were expected to slowly rise back to … Read More
WHAT'S NEW?
Sep’26 EURUSD Report
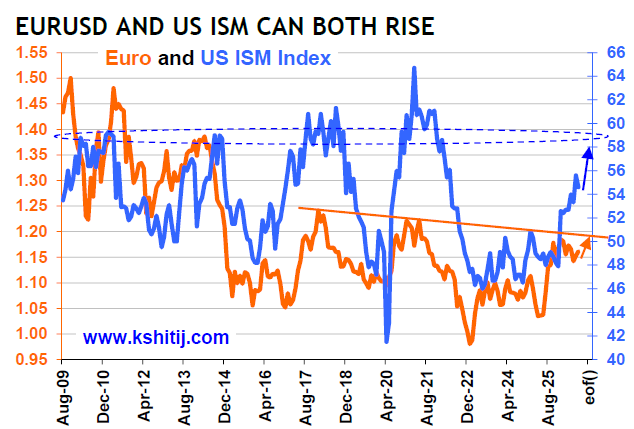
Euro has a positive correlation with US ISM since 2009, except in the period mid-2023 to mid-2025. Positive correlation suggests that while the US ISM rises in the coming months to 58-59, the Euro could rise or remain elevated within …. Read More
WHAT'S NEW?
Aug’26 GOI Report
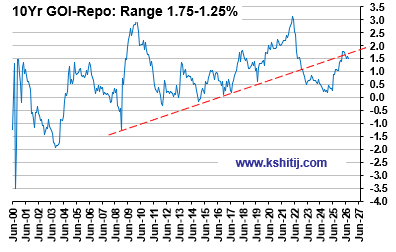
Our last report on 13-Jul-26 report (10Yr GOI 6.74%) stood on a foundation of uncertainty regarding what happens in the Strait of Hormuz. We assumed that Crude would remains below $90, and hence we projected … Read More
WHAT'S NEW?
Jan’26 USDJPY Report
In our 10-Dec-25 report (USDJPY 156.70), we expected the USDJPY to trade within 154-158 region till Jan’26 before eventually rising in the long run. In line with our view, the pair limited the downside to … Read More