

Rupee Forecasting - The KSHITIJ Way
Aug, 18, 2020 By Vikram Murarka 0 comments


To see where the Indian Rupee is going we look at 50 factors. Yes, you read it right, 50 factors.

Those include global currencies (Euro, EM Currencies etc), equities (Dow Jones, MSCI EM indices etc), commodities (Gold, copper, oil etc), bonds (US Treasury, TED Spread etc) and fundamental data.
Correlation studies and inter-market relationships also form a major part of our analysis.
The extensive study we do on all these factors helps us gauge where the Rupee is going, but we don't stop here. We also record all our forecasts and conduct performance reviews in order to make continuous improvements and minimize errors in what we do.

Direction and Timing of Forecasts
Over the years, many of our clients have asked us why, when we publish forecasts, sometimes we predict the direction of the movement correctly, the timing of our prediction is incorrect.
Here, we wish to provide some clarity in that regard.

Tools Used in Kshitij Charts
Some of the basic tools that we at Kshitij use in our charts for our analysis are: 1. Trendlines 2. Candles 3. Moving Averages 4. Line Charts Most of our charts are very simple with only the above mentioned basic tools. We do not use many oscillators or momentum indicators either.
The Reliability of Kshitij Forecasts
Through our currency forecasts and hedging strategies, we like to think that we provide a sense of reliability to our clients. This is most manifest in the 14-year track record of our Dollar-Rupee forecasts, the first, and to our knowledge, still the only one of its kind in India, which proves in real, verifiable numbers, a reliability of 74%.

Rupee Forecasting - Advanced Techniques - The KSHITIJ Way
To see where the Indian Rupee is going we look at 50 factors. Yes, you read it right, 50 factors. Those include global currencies (Euro, EM Currencies etc), equities (Dow Jones, MSCI EM indices etc), commodities (Gold, copper, oil etc), bonds (US Treasury, TED Spread etc) and fundamental data. Correlation studies and inter-market relationships also form a major part of our analysis. The extensive study we do on all these factors helps us gauge where the Rupee is going, but we don't stop here. We also record all our forecasts and conduct performance reviews in order to make continuous improvements and minimize errors in what we do.


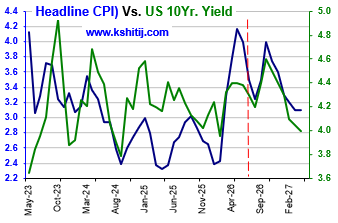
For the last few months we have been looking for Crude to rise towards $130-190 and pull up the US CPI towards 4.6% and the US10Yr Yield to 5.4% by Jan-27. This view has clearly gone wrong with Brent falling sharply below $90 as a result of the US-Iran peace deal, which is the …. Read More
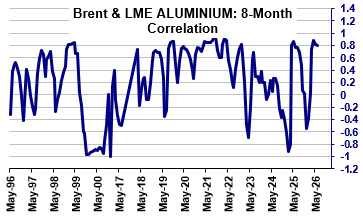
In our June 2026 report (1-Jun-26, Brent @ $95.47), we had expected Brent to correct to $88 before bouncing back to $120 and $145 by Aug-26 and Sep-26, respectively. A sustained trade below $90 was said to be incumbent on a fully credible resolution of the US-Iran war. … Read More
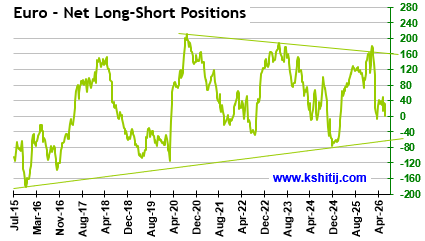
In our June 2026 report (10-Jun-26, EURUSD 1.1546), we expected the Euro to rise towards 1.17 in Jun-26 before reversing lower, with surging crude prices, rising inflation, and potential central bank rate hikes posing key risks amid the ongoing US-Iran conflict …. Read More
In our last report on 03-Jun-26 report (10Yr GOI 7.03%) we remained bullish on Brent and therefore called for higher CPI and higher Yields. At the same time, we said, “Our view will come under threat if Brent trades … Read More

In our 10-Dec-25 report (USDJPY 156.70), we expected the USDJPY to trade within 154-158 region till Jan’26 before eventually rising in the long run. In line with our view, the pair limited the downside to … Read More

Our July ’26 Dollar Rupee Quarterly Forecast is now available. To order a PAID copy, please click here and take a trial of our service.