

Euro Long term Forecast - Jul'17
Jul, 08, 2017 By Vikram Murarka 0 comments

8-July-17 / Euro 1.1392
EXECUTIVE SUMMARY:
In our Jun’17 report, we expected the resistance cluster of 1.1300-1.1450 to hold and either 1.1285 or 1.1400 (in the best case scenario) to be a major top to be followed by a major correction.
The outer limit of our resistance band at 1.1450 has been tested and is holding so far. As such, we maintain our view of a medium-term top being formation near 1.1450 and Euro weakening towards 1.12-10 over the next few months. On the other hand, the alternative scenario of an immediate break above 1.1450 and a long term bullish reversal of the major bear market since 2008 gains currency due to rising German-US yields spread. Possibly, the Euro will choose its path for this quarter in the next 1-2 weeks by either breaking above or staying below 1.1450-1500. Our bias is neutral at the immediate juncture.
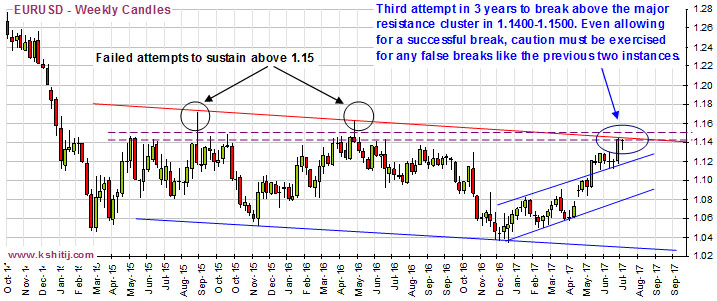
The chart above shows Euro Resistance at 1.1450 on red channel trendline which has capped the upside for the last 2 years. So far, this Resistance is holding even on the third testing, supporting our previous view of a medium-term top at 1.1450. At the same time, we allow for a false spike into the 1.15-16 region.
Euro & German-US yield spread:
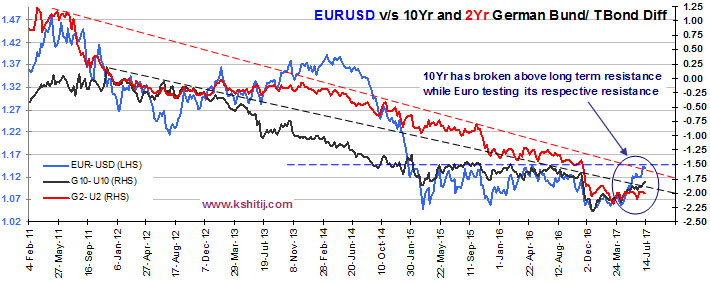
The G10-US10Yr Spread (-1.81%, RHS on chart above) has broken above the long term trendline resistance as shown on the chart above while the G2-US2Yr Spread (-2.01%, RHS on the chart above) is yet to its face long term resistance. The breakout of the 10Yr strengthens the possibility of Euro rising above 1.15-1.16 but we still need an actual price confirmation from Euro.
Euro Fractal revisited: Can Euro embark on a bull market in 2017 itself?
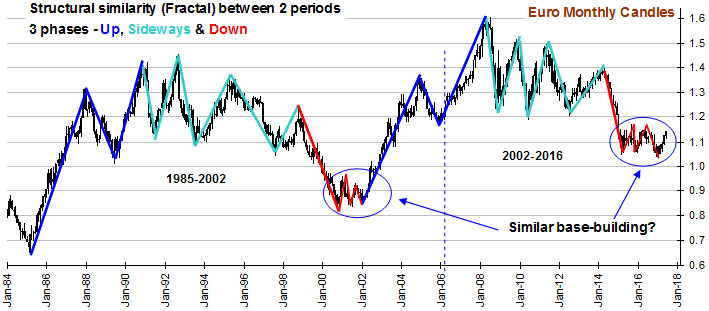
This chart was last discussed in the May’17 report though we have been tracking this Fractal since May’16. There is startling similarity in the price action between the periods of 1985-2002 and 2002-2016. Based on this, and the rally from 1.0339 to 1.1427 seen so far in 2017, there is a chance that in case a successful break above the May ’16 top of 1.1620 is seen, the Euro will register a higher high, the initial signal for a new bull market.
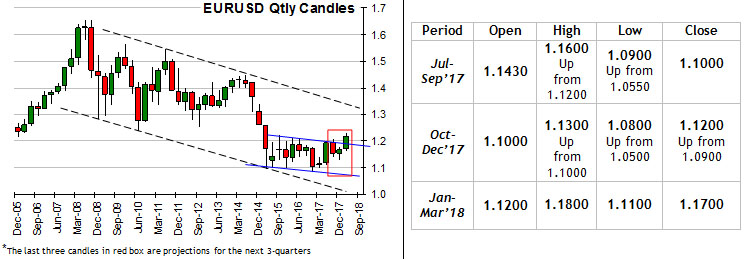
Quarterly Projections
Conclusion
Euro is testing a crucial resistance at 1.1400-1.1600. If this holds, the Euro may retreat towards 1.10 in the coming months. On the other hand, a weekly close above 1.16 may signal a long term reversal and may open much higher levels near 1.20. We have to see which path the currency chooses in July.

You may also like:


In our last report (27-Feb-26, UST10Yr 4.01%), which was published just one day before the start of the US-Israel-Iran War on 28-Feb, we had continued to target 4.60% on the US10Yr based on expectations of higher Crude. At that time, we were looking for Brent to rise …. Read More

The escalation of war between US and Iran throughout March-26 has led to a rally in Brent prices to as high as $119.50, exceeding our bullish targets by a large margin, much ahead of expected time. Will it remain bullish for the coming years?… Read More

Our view of a fall towards 1.14 seems to be playing out well so far as the tensions in the Middle East and the US-Iran conflict have triggered a rise in Dollar Index and crude oil prices, thereby weakening to Euro to 1.1507 so far in Mar-26. Will it again attempt to rise targeting 1.20? Or will it remain below 1.19/20 now and see an eventual decline to 1.10? …. Read More
In our 09-Mar-26 report (10Yr GOI 6.69%) we had warned that the sharp rise in crude due to the US-Iran conflict could push Brent toward $134, which would lift CPI toward ~6.2%, eliminating any chance of RBI easing, and potentially force tightening. This inflation shock, along with higher US yields, was expected to push the 10Yr GOI up to … Read More

In our 10-Dec-25 report (USDJPY 156.70), we expected the USDJPY to trade within 154-158 region till Jan’26 before eventually rising in the long run. In line with our view, the pair limited the downside to … Read More

Our March ’26 Dollar Rupee Monthly Forecast is now available. To order a PAID copy, please click here and take a trial of our service.