Author Archives: Vikram Murarka

About Vikram Murarka

Chief Currency Strategist at KSHITIJ.COM. Likes to look at the markets from many different angles. Weaves many conventional and unconventional technical analysis techniques and fundamental analysis into a global macro perspective. Likes to take the road less traveled.

Case Study 1 - A Dollar-Yen Swap

Issues in Corporate Risk Management – Stick to Objectives; Series on Chart Pattern

In this Issue

  • Series on Issues in Corporate Risk Management – Part 2 – Stick to Objectives

Issues in Corporate Risk Management

Keep the Objective in mind. It pays

The definition of proper Objectives is the first step in effective Corporate FX Risk Management. Get your objectives wrong and you are most likely courting trouble. We had taken this up in the Issue dated 28-Mar-04. Having set the correct objectives, the Risk Manager needs to keep them in mind after the Hedge Strategy has been implemented, so as to not be led astray by the market. It pays immensely. 

A conglomerate with a Rupee Balance Sheet had a large foreign currency loan book, 85% of which was denominated in US Dollars. The balance was in D-Marks, Yen and Sterling. Circa 1994-95, the Risk Manager decided to reduce the currency concentration risk and rebalance the loan basket using Currency Swaps. The Objective was clearly defined as Risk Diversification. 

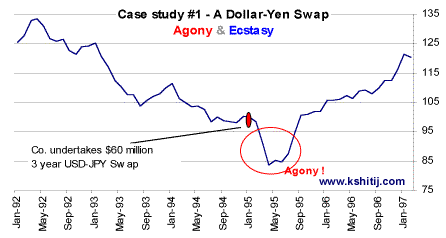
It was decided to swap 10% of the Dollar loans into Yen. The Yen was chosen because interest rates were close to zero as compared to 6.50-6.75% on the USD 6-month Libor, giving a huge interest benefit. Further, the Yen was expected to weaken over a 3 year time frame. The Swap took place in Jan-95 near 100 on the USDJPY Spot.

Case Study 1 - A Dollar-Yen Swap

Almost immediately thereafter, the Dollar dived against the Yen, to hit an all time low of 79.80 in April 1995. There were 3 months of intense agony. The company had never undertaken such a large forex deal. The Board was on the edge. Had the deal gone horribly wrong? The Risk Manager reminded the Board that the objective was Risk Diversification and only 10% of the loan book had been put on the line. Further, the deal had a 3 year tenor.

The market eventually turned around and the danger passed. The Swap came back into money. Now the Board was tempted to square off the trade and book whatever small profit was available. Again the Risk Manager stuck to his guns, saying the Objective was long term Currency Diversification, not short term Trading Profits. The Board backed down and the Swap was allowed to run its course.

The Yen eventually touched 120 in 1997. The company booked a huge currency and interest rate gain of almost $17 million. Those who have been in the market through that period would appreciate how difficult it must have been to steer such a trade through to its end. It is immensely commendable that the Risk Manager did not waver from the Objective, neither in bad times nor in good times.

The gains from the deal (which in itself was well conceptualized), was realized by remaining focused on the Objective.

The Shoulder Head Shoulder Chart Pattern

The Shoulder Head Shoulder chart pattern

A common mistake

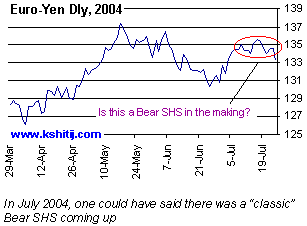
The Shoulder-Head-Shoulder is one of the most popular Reversal patterns in classical charting as it is visually appealing and promises handsome gains if read correctly. Sometimes, Chartists tend to make a common mistake in reading it though, as illustrated below:

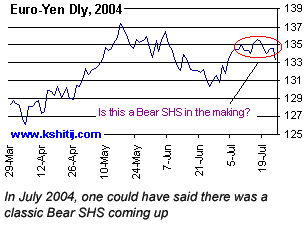
Euryen daily 2004 Euryen daily-04 not bear shs

The fault lay not in the chart pattern, but in the initial reading. A very important point to remember about SHS is that the profit objective from the Neckline is roughly equal to the distance between the Head and the Neckline. As such the previous trend should have been of a sufficiently long duration to accommodate the profit objective. Further, since the SHS is a Trend Reversal pattern (not a Trend Correction pattern), there should ideally be further room available (beyond the profit objective) for the new trend to perpetuate. These conditions were not met in this case of a “false” SHS.

GBPUSD Weekly Close Bear SHS did not meetThe Charts aren’t perfect, though

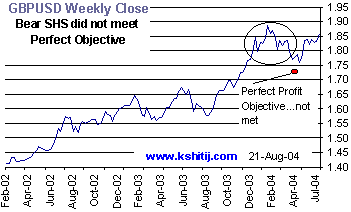
Of course, It does happen sometimes, that even a Classical SHS, meeting the conditions mentioned, does not deliver to its full potential, as seen alongside. The GBPUSD had developed a pronounced Bear SHS in Q1-04, with an ideal Profit Objective near 1.7150. Unfortunately, the low seen was only 1.7480 on 14-May-04, well short of the target.

Since Charting is not an exact science, the only way to deal with this would have been to employ a Trailing Stop Loss to protect Short positions. This is the realm of skilful Trading, an ability acquired with effort and experience.

Difference between 10-Year German Bund and the 10-Year US Treasury Bond

BOND YIELD DIFFERENTIALS and EURO-DOLLAR

The best long-term investors do not enter into the age old “Fundamentals v/s Technicals” debate. They try and combine both techniques to their advantage. This article focuses on how both Fundamentals and Technicals can be combined in the currency markets and what they are together saying about the Euro-Dollar rate at the moment.

Fundamentals Behind Currency Rates

It is, perhaps, very easy to find the Fundamental drivers for the Equity markets in general and for individual stocks in particular. Market growth, market share, sales, profits, P/E ratios etc. are standard (and very useful) tools in stock-picking. What are the fundamental drivers behind Currency movements? Given that the currency market is most given to Technical Analysis, the Fundamentals are many a times referred to as “Funnymentals”.

Type of Transaction Share of Daily Volume
Speculation 93.7%
Capital Flow related 4.6%
Goods & Services related 2.1%


It is, of course, understandable that Technicals should be the technique of choice in the currency market, since a lion’s share of the daily turnover of $1.9 trln is speculative. The two major Fundamental drivers in the currency market are Trade flows and Capital flows. Of these, the volume of Capital Flows is bigger than that of Trade Flows and exercise a greater influence on currency rates, as can be seen in the table above.

The following might sound like heresy in the current climate where a weaker Dollar is commonly seen as the cure for the US Trade Deficit, but, since the major part of global trade is actually US Dollar denominated, trade flows have minimal impact on currency rates. Also, the leeway for choosing any currency other than the Dollar as the Invoicing Currency is usually limited. As such, Capital Flows are considered to be the most important fundamental drivers behind long-term currency movements.

Like water flows to reach its lowest level, capital flows to where the Return on Capital is highest. In the currency market, this truism is expanded to “capital flows to where the relative return on capital is highest”. Long-term currency investors like to watch the changes or movement in the Differential between the Government Bond Yields of two countries as a means of forecasting currency movements. Investments flow, obviously, to that Bond market whose yields are comparatively higher. As the bond yields in a country continue to rise relative to the bond yields in another country, there is an increased demand for that country’s currency, which drives it higher against the other country’s currency.

The emphasis here is on long term investing, because it is at epochal market turning points/ trend reversals that fundamentals are at their most potent.

The Bund-Bond Differential vis-a-vis Euro-Dollar

The chart below shows the relation between the yield differential between the 10-Year German Bund (the name for German Government Bonds, which are taken as a proxy for Euroland Bonds because the Eurozone now has a unified Monetary policy) and the 10-Year US Treasury Bond vis-à-vis the Euro-Dollar exchange rate.
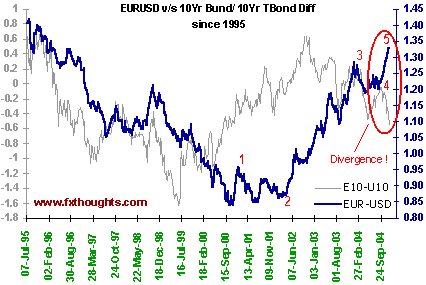
Difference between 10-Year German Bund and the 10-Year US Treasury BondOn the Left Hand Axis we track the difference between the Yields on the 10-Year German Bund and the 10-Year US Treasury Bond (the Grey series). On the Right Hand Axis we track the Euro-USD exchange rate (the Blue series). The pre-introduction rates for EUR-USD have been derived from the Dollar-Deutschemark rates converted at the Euro-Deutschemark rate.

As can be seen, the Yield Differential, which was 62 bp in the favour of the Bund in July-95, declined to a negative 159 bp by June-99, over roughly four years. During this period the EUR-USD rate fell from 1.4171 to 1.0535. We then encounter a 16-month lag wherein although the Yield Differential rose from -1.59% in June 99 to -0.507% in Nov-00, the Euro continued declining against the Dollar to hit a low of 0.8378 in Nov-00, before embarking on a long-term upmove. From Nov-00 to Nov-02, the two series moved in tandem with the Yield Differential rising from -0.507% to +0.608% and the EUR-USD rate rising from 0.8378 to 1.0098.

The point to be noted is the overall positive correlation between the Yield Differential and the Exchange Rate over a long period of time and that the former is a leading indicator of the latter. You can find a Lead Adjusted version of the above chart at the end of this article, alongwith correlation details.

Skating on Thin Ice?

Cut to the present. As can be seen, the Bund-Bond Differential has again slipped deep into the negative, diving from near -0.05% on 17-Sep-04 to -0.57% 0n 03-Dec-4. This means that the Yield Differential does NOT currently support the Euro, it supports the Dollar. Yet, the Euro has shot up against the Dollar since Sep-04. There is, thus, a stark divergence between the Differential and the Exchange Rate today, suggesting that the Euro lacks a very important Fundamental Support.

If we now bring in the Technicals and impose an Elliot Wave count on the Euro-Dollar chart, it may seem that the Euro could be skating on thin ice.

Lets go over the Wave Count:
Wave 1 started from 0.8378 in Nov-00 and ended near 0.9516 in Jan-01
Wave 2 ended near 0.8708 in Feb-02. Some may even say that Wave 2 ended near 0.8473 in July-01.
Wave 3 ended near 1.2818 in Jan-04
Wave 4 ended near 1.1887 in May-04

We may now be in Final Wave 5 of the big upmove that started from 0.8378 in Nov-00. According to Elliot Wave Theory, the Fifth Wave is usually the most speculative, when all the latecomers join the party, usually after the fundamental drivers of the big trend have changed.

This is so starkly visible in the presented chart, it is almost literally crying for attention. While the Euro may well continue to strengthen in the short term, long-term investors may want to buy some protection against a Euro fall.

Lead Adjusted Chart
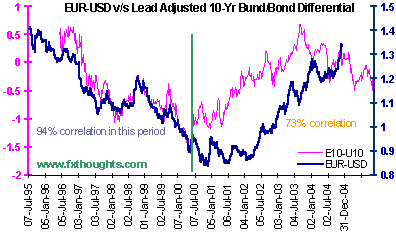
EURUSD v/s Lead Adjusted 10-Yr Bund/ Bond DifferentialThe relation between the Bund-Bond Differential and the USD-DMark rate was very close at 94% till the introduction of the Euro. This can be seen in the chart alongside, where the 12-month Lead Adjusted 10-Yr Bund/ Bond Differential is juxtaposed against the EUR-USD rate. 

The relation between the Bund-Bond Differential and the EUR-USD rate is looser now at 73% because the Euro represents many countries, not just Germany. Yet, this is a high enough correlation to warrant consideration.

Note: This article has also appeared on http://www.working-money.com under the name “Fundamentals + Technicals together again”
EURUSD Put

ISSUES IN CORPORATE RISK MANAGEMENT: Focus on Objectives; Learn from your mistakes

In the issue dated 25-Aug-04 we presented the case of a corporate that stuck to its long term objective even in bad times on a currency swap that went very bad initially; but ultimately booked handsome gains at the end of three years. We now present the case of a corporate that initially failed to realise profits because it lost focus of its objectives. But it learnt from its mistake and made good the next time the same opportunity presented itself.

Business Exposure: An Indian Importer, having all imports invoiced in US Dollars.
Objective: To diversify a part of the exposure into another currency to reduce Currency Concentration Risk, through off-balance-sheet transactions.
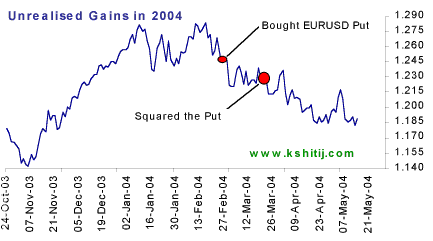
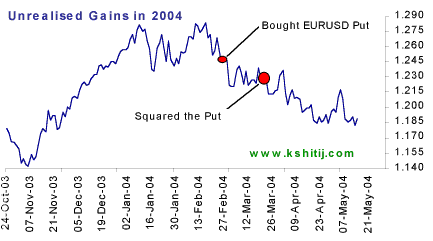
Forecast on 26-Feb-04: While below 1.30, there were chances of EURUSD falling to 1.18 (5.2%) over 2-3 months.

Eurusd put

Strategy adopted:Bought a EURUSD Put at a strike of 1.2425 on a small part of its total exposure. The Put served as a proxy for currency diversification
Option Price Paid: 2.02%

The corporate created a synthetic Euro Payable, where it would gain if the Euro fell. But, the Euro fell only slightly and then started trading sideways.

The Option was losing time value and the Corporate was concerned that it had paid the 2.02% Premium in vain. Its focus shifted from its objective of Currency Diversification to minimizing the cost of hedging. So, in order to recoup part of the premium paid, it squared the Option. There was a sigh of relief. But, the Euro started falling almost immediately thereafter and went on to meet its target of 1.1850.

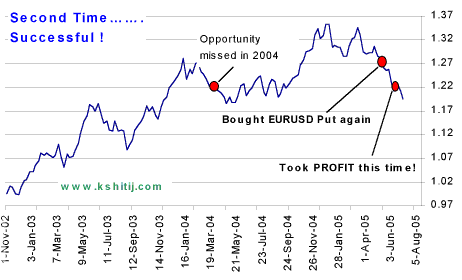
Had the Corporate stuck to its objective of reducing its Currency Concentration Risk, it would have retained the Hedge and made good money thereby. Nevertheless, it learnt from its mistake and replicated the deal in 2005 when a similar opportunity presented itself.

EUR put usd call options

No mistake the second time:
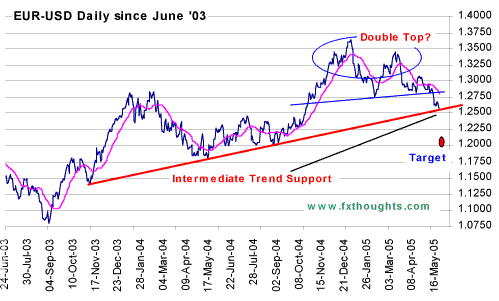
In the first quarter of 2005, EUR-USD had fallen from its post introduction high of 1.3665 and had traced a classic Double Top (refer below). The forecast was bearish, targeting 1.20.

Recognising the opportunity, the Corporate again bought EUR Put/ USD Call Options with the same objective of diversifying the currency composition of its Imports as also of lowering the cost of Imports.

The market again hesitated for a while after the deal was done, causing some anxiety to the Corporate. But remembering the experience of 2004, it stood its ground. Finally the Euro fell and the Corporate made a very decent amount of money on expiry of the Option. This success has now given the Corporate enough confidence to be more proactive in managing its Currency Exposures.

Moral of the story: Its alright to make mistakes. But learn from it and do better next time. Do not give up on Forex Risk Management as “speculation” if things don’t work out the first time. And, things do work out if the objective is well thought out, the hedge strategy is well laid out and you work according to plan.

Double Top Chart Pattern

Classic Double Top Chart Pattern

Series on Chart Patterns

Classic Double Top

It is not often that the market present a copybook example of a classic chart pattern in real life. The Euro-US Dollar traced a classic Double Top recently. We present here an article we wrote for the “Technical Analysis of Stocks and Commodities” magazine on 23-May-05 when the EUR-USD rate was 1.2585

Back in Jan-05 (please refer to “The Colour of Money” issue dated 12-Jan-05) the Elliot Wave counts on EUR-USD since 2002 and the 10 Yr Bund-Bond Yield Differentials together indicated that the Euro would fall.

The promise of the Jan-05 outlook had worked out correctly. Towards the end of May-05, the charts presented a compellingly bearish EUR-USD picture. There was a

  • Completion of a 5-Wave uptrend from Oct-00
  • Break of Trend Support coming up from Apr-02
  • Double Top created since Nov-04 with Tops registered in Dec-04 and Mar-05.
  • A Negative Crossover on the 200-day Moving Average

Not all at once
Even though the charts were bearish, the Euro was not falling further. One of the most intriguing facets of the market (as of life) is that even when technical targets are clearly known and set, they do not materialise immediately. The targets take time to come by. As Einstein said of Time, “The only reason for time (to exist) is so that everything doesn’t happen at once.”

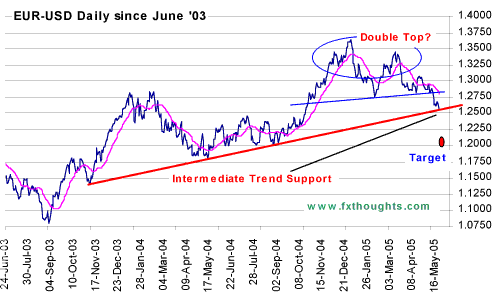
EURUSD Classic Double Top ChartIt takes time for the market to reach where it has to because it needs to overcome obstacles on the way, such as the one in shown in the chart alongside.

Although the big uptrend since 2002 had been broken, there was an intermediate Trend Support coming up from Nov-03. It provided Support just above 1.2500. This had to break for the target of 1.20 to be achieved.

The question was, could there be a small bounce to 1.27 before the trendline broke, in a case of “Reversal to Double Top Neckline” (the blue line in the chart above)? Or would there be a clean break of the intermediate Trend Support (the Red line)?

French Vote as catalyst

As it turns out, the French “No” vote to the Euro constitution, followed by the Dutch “No” in June proved to be a bearish catalyst, enabling the EUR-USD to break cleanly through the intermediate trend support shown above. As the market reacted negatively to the news, the Euro fell to eventually fulfill the 1.20 target suggested by the classic Double Top shown above.

A very satisfying Double Top and yet another shining example of how Fundamentals align themselves to prove the Charts correct!