

The Shoulder Head Shoulder chart pattern
Aug, 25, 2004 By Vikram Murarka 0 comments

A common mistake
The Shoulder-Head-Shoulder is one of the most popular Reversal patterns in classical charting as it is visually appealing and promises handsome gains if read correctly. Sometimes, Chartists tend to make a common mistake in reading it though, as illustrated below:
 |
 |
The fault lay not in the chart pattern, but in the initial reading. A very important point to remember about SHS is that the profit objective from the Neckline is roughly equal to the distance between the Head and the Neckline. As such the previous trend should have been of a sufficiently long duration to accommodate the profit objective. Further, since the SHS is a Trend Reversal pattern (not a Trend Correction pattern), there should ideally be further room available (beyond the profit objective) for the new trend to perpetuate. These conditions were not met in this case of a "false" SHS.
 The Charts aren't perfect, though
Of course, It does happen sometimes, that even a Classical SHS, meeting the conditions mentioned, does not deliver to its full potential, as seen alongside. The GBPUSD had developed a pronounced Bear SHS in Q1-04, with an ideal Profit Objective near 1.7150. Unfortunately, the low seen was only 1.7480 on 14-May-04, well short of the target.
Since Charting is not an exact science, the only way to deal with this would have been to employ a Trailing Stop Loss to protect Short positions. This is the realm of skilful Trading, an ability acquired with effort and experience.

You may also like:
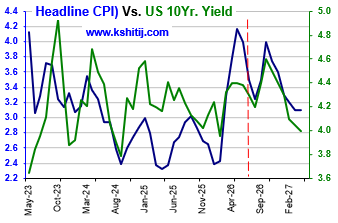
For the last few months we have been looking for Crude to rise towards $130-190 and pull up the US CPI towards 4.6% and the US10Yr Yield to 5.4% by Jan-27. This view has clearly gone wrong with Brent falling sharply below $90 as a result of the US-Iran peace deal, which is the …. Read More
In our June 2026 report (1-Jun-26, Brent @ $95.47), we had expected Brent to correct to $88 before bouncing back to $120 and $145 by Aug-26 and Sep-26, respectively. A sustained trade below $90 was said to be incumbent on a fully credible resolution of the US-Iran war. … Read More
In our June 2026 report (10-Jun-26, EURUSD 1.1546), we expected the Euro to rise towards 1.17 in Jun-26 before reversing lower, with surging crude prices, rising inflation, and potential central bank rate hikes posing key risks amid the ongoing US-Iran conflict …. Read More
In our last report on 03-Jun-26 report (10Yr GOI 7.03%) we remained bullish on Brent and therefore called for higher CPI and higher Yields. At the same time, we said, “Our view will come under threat if Brent trades … Read More

In our 10-Dec-25 report (USDJPY 156.70), we expected the USDJPY to trade within 154-158 region till Jan’26 before eventually rising in the long run. In line with our view, the pair limited the downside to … Read More

Our July ’26 Dollar Rupee Quarterly Forecast is now available. To order a PAID copy, please click here and take a trial of our service.