4-Sep-17
Dow 21988/ Sensex 31809
RECAP
Our note of caution on the Dow Jones (21988) and Sensex (31809) in our Aug ’17 report has stood us in good stead as both the indices saw a corrective dip in August. In contrast, the Shanghai (3372) has become more bullish, breaking above 3400 in line with our expectation. The Mexican and Turkish markets have consolidated sideways in August while the Kospi (2341) has come off from Resistance near 2500, exactly in line with expectation. US economic data (Retail Sales, GDP) have improved but US yields have dipped. The Euro, Gold and industrial metals have surged. Indian economic data continues to disappoint. Inflation has picked up a bit while IIP and GDP have fallen due to GST. On the positive side, the August Manufacturing PMI has shown a decent bounce to 51.2, from 47.9 earlier.
EXECUTIVE SUMMARY
We remain cautious on the Dow and Sensex and bullish on the Shanghai, which is likely to outperform both.
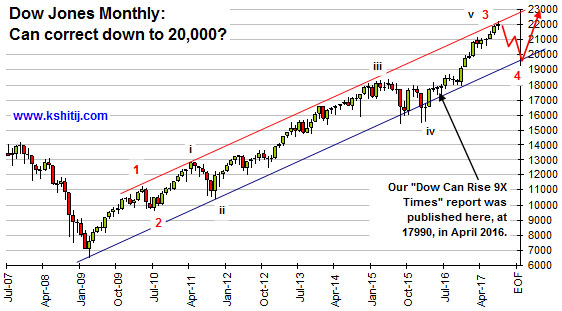 Dow Jones to fall to 20,000?
In our multi-year forecast on the Dow Jones, published on 26-Apr-16, (DJIA was 17990 then) we said, “we look for returns of 9X in the next 10-15 years. For now, we can well target 22500 over the next 12 months.” The upmove was expected to start from August 2016.
The Dow has risen 23% since then, exactly as expected, to a high of 22179 in August 2017. A bit of profit-taking has started from there. As such, trying to push further for 22500 may not be prudent. Rather, we should start looking for a decline towards 20000 over the next couple of quarters.
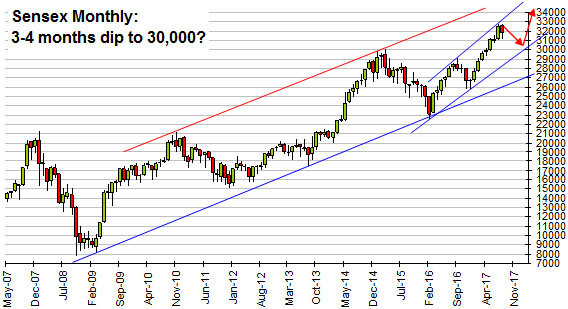 Sensex too can fall to 30,000?
A similar fall towards 30,000 might be seen in the Sensex (31809) over the next few months. That would translate to about 9375 on the Nifty.
The strong correlation between the Dow Jones and the Sensex could itself be a trigger for a fall in the Sensex. Further it is a fact that the PE ratio is very high and it is difficult to find value at current levels. A bit of a decline in prices coupled with an increase in earnings would provide the base for the next leg of the upmove that could target 34000 in the longer term.
Gold outperforms Dow Jones and Sensex in near term
Gold, which has risen to near 1340 and can target 1375 also, is outperforming the Dow Jones and the Sensex in the near term.
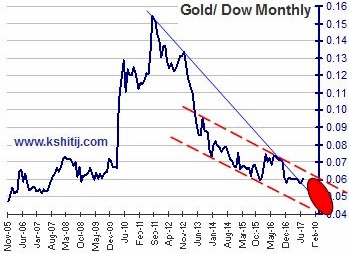 The Gold/ Dow ratio (0.0609) can rise to 0.0620-30 (+3.3%) in the next month or two. That said, Gold will continue to underperform the Dow in the longer term while the ratio remains below 0.0630, within the downtrend red channel and could come down towards 0.04 over the next several months, as marked by the red oval above.
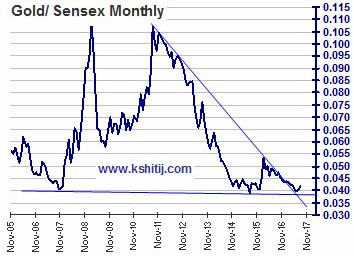 In contrast to the overall downtrend that still persists in the Gold/ Dow ratio, the Gold/ Sensex ratio (0.0421) seems to be doing better, with long-term Support seen just below 0.0400. While this Support holds, the ratio might trade sideways between 0.0390-0.0450 for a few months. We need to see if the Sensex will continue to underperform Gold allowing the ratio to rise to 0.0500.
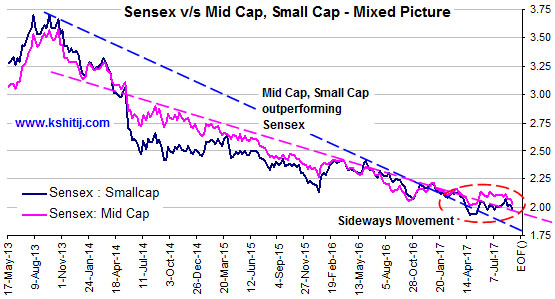 Mixed picture within Indian Equities
The chart alongside depicts the ratio of the Sensex v/s Mid Cap Index and Small Cap Index respectively. These ratios have been falling since 2013, signifying that the Mid Cap and Small Cap Indices have been outperforming the large cap firms in the Sensex. This is a sign of a bull market. Contrarily, in a bear market, the Mid Cap and Small Cap will underperform the Sensex.
While the overall downtrend in these ratios since 2013 still persists, both ratios have been moving sideways since April 2017. This suggests that the Bull market is slowing down. Although the ratios still point downward overall, if the current sideways movement gives way to a rise in the ratios, it could signal a Bear market. The picture is mixed at the moment – the bull market is not fully over, but it is slowing down and we have to be careful to see whether it morphs into bearishness.
 Shanghai targets 3550
In our Aug ’17 report we said, “As long as the support at 3150 holds, the trend remains firmly up and a break above 3300 may open up 3450-3500, appreciation of another 4.5-6.0%.”
The Shanghai (3372) indeed rose past 3300 in August and may test 3500-50 in the next couple of months.
Shanghai outperforming Dow and Sensex
The current rise in the Shanghai is in contrast to the recent dips in the Dow and Sensex, making it stand out as an outperformer against both. This is contrary to our expectation that the Shanghai would actually underperform (see our Global Equities report dated 07-June-17).
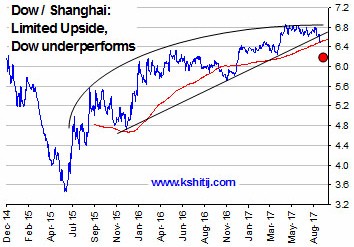 Instead of rising towards 7.50 (as expected in our June 2017 report), the Dow/ Shanghai ratio (6.52) has come down and upside looks limited to 6.80 for now. The 200-day Moving Average (near the current) is likely to break pushing the ratio down towards 6.475 over the next couple of months.
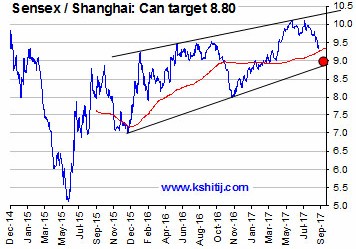 Similarly, we had been looking for the Sensex/ Shanghai ratio (9.43) to rise towards 10.50, but there has been a sharp fall from just above 10.00 instead. Here too, the market is testing the 200-day Moving Average at the current level, and can well break lower to target trendline Support near 9.00-8.80 in a month or two.
The outperformance of the Shanghai is being reflected in the sharp appreciation of the Chinese Yuan from 6.8564 (26th June) to 6.5524 now. The USDCNH may now target 6.48 over the next few weeks.
As mentioned in the August report, the rise in the Shanghai is being aided by the strong rise in industrial metals like Copper, Zinc and Aluminium.
 Follow-up on KOSPI: Caution Pays off
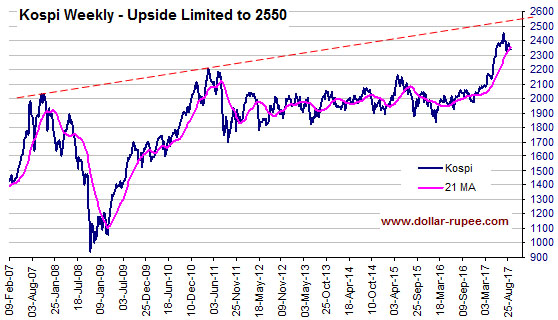
Our cautious stance on the KOSPI in the August report (when the market was 2395) has paid off so far as the market has dipped to a low of 2310.20 in mid-August.
It now has immediate Support in the 2300-2280 region. While that holds one final rise towards 2550 could be seen over the coming weeks. However, the presence of long-term trendline Resistance there (as seen in the chart alongside) suggests chances of a sizeable correction/ fall towards 2250 from somewhere near 2550. This is broadly in line with the overall cautious stance on the Dow Jones and the Sensex.
Conclusion
The US and Indian equity markets could be vulnerable to a corrective decline over the coming months. The South Korean index too might have limited upside in the medium term. The Shanghai is bullish in the near to medium term and may outperform the US and Indian markets. Looking at USA and India through the prism of Gold suggests that USA might outperform Gold while India might underperform Gold.


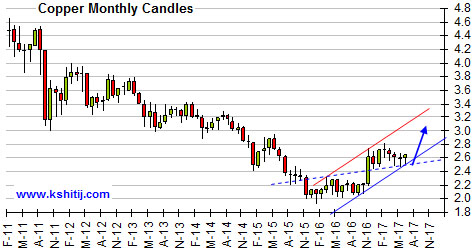 Copper started rising since Nov’16 after the sideways consolidation below 2.40 for almost a year from Nov’15 to Oct’16. Thereafter the short term channel uptrend has been holding well with a possibility of 2.50 being an immediate bottom for the coming months.
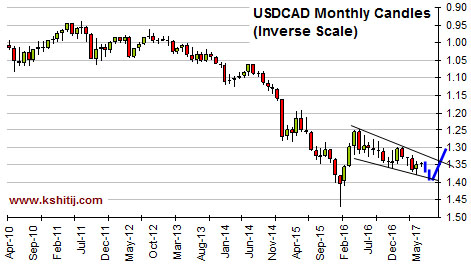 The USDCAD monthly chart alongside is shown on an inverted scale to easily identify its inverse correlation with AUDUSD.