

Aussie Long term Forecast - Aug'17
Aug, 05, 2017 By C S Vijayalakshmi 0 comments

AUDUSD 0.7928/ Copper 2.888 / CADUSD 0.7908/ AUDINR 50.467
Recap:
In the Jul’17 report when AUDUSD was 0.7602, we had expected a dip towards 0.75 in July followed by a sharp rise towards 0.78-0.80 in August. An actual break out above the major resistance of 0.78 was expected over August and September.
EXECUTIVE SUMMARY:
Aussie rose sharply in July itself testing the target of 0.80 much faster than expected, instead of dipping to 0.75 first. The break out on the upside has been triggered by an already rising CADUSD as seen in our July report. The initial rise in CAD in June has lead to a sharp rise in Aussie and Copper in July. We expect the rally to continue for the next few months.
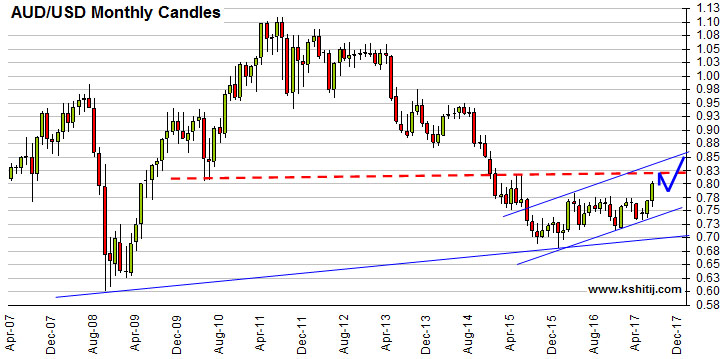
Aussie Monthly Chart
Our Aug-Sep’17 target of 0.80 has been met in July itself and the price could now gather momentum over the next couple of months to move higher towards 0.83-0.85 levels. The rise above 0.78-0.80 seems to be a significant break out signaling a sharp upward rally for the medium term, with Support seen near 0.78-0.77 now.
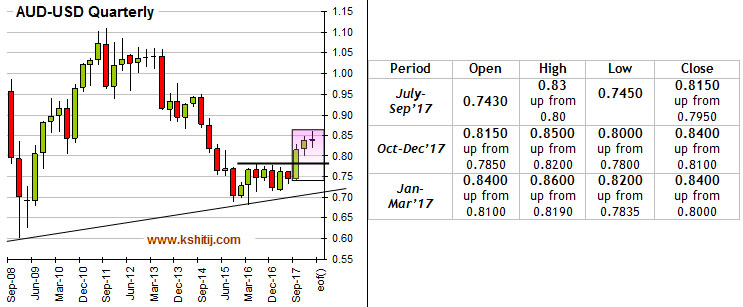
Quarterly Projections
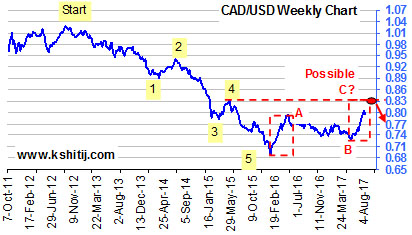
CAD/USD
The strength in the Canadian Dollar has played out well in July from levels near 0.7714. As mentioned in our July report, the price is trading in its last phase of the A-B-C corrective move of the entire fall from levels near 1.04 in Sep’12. We could possibly see a rejection from levels near 0.83 towards 0.77 which could be tested in August.
Note that 0.83 is a crucial resistance, last seen in May’15 and could act as a decent resistance in the coming months.
Copper & AUDUSD: Weekly
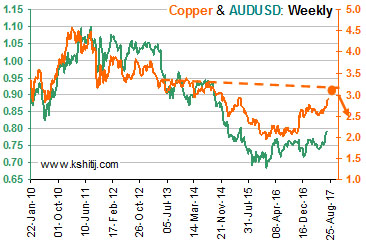 Copper finally broke above the important interim resistance near 2.75 in July to head towards our initial target of 2.78. Now we could see the rally to continue towards crucial resistance zone of 3.00-3.25 from where a rejection seems more likely.
Aussie has been rising in line with the rise in Copper and the Canadian Dollar. While Copper continues its rise towards 3.25, Aussie could move up towards 0.83 before seeing a dip back towards 0.80.
AUD/INR-Weekly
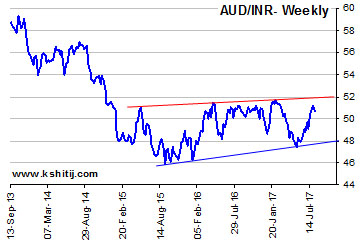 AUD/INR (50.766) has an important resistance near 52 which is likely to hold for the medium term. The currency pair has been trading below 52 since 2015 and while that holds, we could possibly see a pull back towards 50.
Although the AUD/USD chart by itself looks strong just now, but unless AUD/INR breaks above 52, the Indian Rupee is likely to remain strong against the Aussie in the coming months. Only a break above 52 (on AUDINR), if seen would force us to revise our current view.
Conclusion
Aussie has opened up upside levels of 0.83 after breaking above important resistance near 0.78. There could be some initial rejection from levels near 0.83, possibly in August which could lead to a corrective dip towards 0.80-0.79 levels before actually moving up towards 0.85 in September.

C S Vijayalakshmi
Vijayalakshmi has the rare ability to look at charts using both Classical charting as well as Elliot Waves, which she combines with excellent proficiency in Excel. A growing presence in the social media sphere, she is also an accomplished danseuse and choreographer.
You may also like:


In our last report (27-Feb-26, UST10Yr 4.01%), which was published just one day before the start of the US-Israel-Iran War on 28-Feb, we had continued to target 4.60% on the US10Yr based on expectations of higher Crude. At that time, we were looking for Brent to rise …. Read More

The escalation of war between US and Iran throughout March-26 has led to a rally in Brent prices to as high as $119.50, exceeding our bullish targets by a large margin, much ahead of expected time. Will it remain bullish for the coming years?… Read More
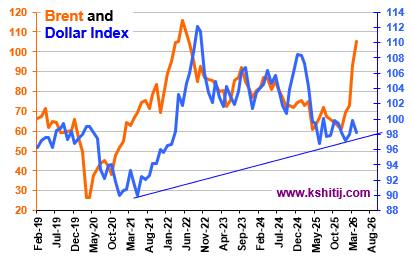
The major rally in crude prices over the last 1-month and continued elevated prices through the year could lay major impact on the currencies. With the Dollar Index and Crude prices being elevated there could be little room for Euro on the upside. However, it would be interesting to see if any resolution is arrived at between US and Iran this year itself which could lead to some stability in prices. …. Read More
In our 09-Mar-26 report (10Yr GOI 6.69%) we had warned that the sharp rise in crude due to the US-Iran conflict could push Brent toward $134, which would lift CPI toward ~6.2%, eliminating any chance of RBI easing, and potentially force tightening. This inflation shock, along with higher US yields, was expected to push the 10Yr GOI up to … Read More

In our 10-Dec-25 report (USDJPY 156.70), we expected the USDJPY to trade within 154-158 region till Jan’26 before eventually rising in the long run. In line with our view, the pair limited the downside to … Read More

Our April ’26 Dollar Rupee Quarterly Forecast is now available. To order a PAID copy, please click here and take a trial of our service.