Issues in Corporate Risk Management - The need to define proper objectives
Mar, 28, 2004 By Vikram Murarka 0 comments

A few words…This is the second issue of “The Colour of Money” after its revival. Many of our old Readers have written to say they are glad to receive this publication again. We thank them for their generosity. And we are glad to publish “The Colour of Money” because it gives us the scope to put to paper serendipitous thoughts that do not otherwise find room for expression in the daily hurly-burly of the market. Please feel free to circulate this e-mag among your friends if it strikes a chord within you somewhere.
In the last issue we had started a series on Chart Patterns, which we will continue in the next issue. In the current issue we are starting another series on Corporate FX Risk Management.
In this Issue
- Series on Issues in Corporate Risk Management – Part 1 – Focus on Objective
ISSUES IN CORPORATE RISK MANAGEMENT
The need to define proper Objectives
This is an issue not usually dwelt upon in market literature or forums and chat rooms, but success in Corporate FX Risk Management, or even speculative trading for that matter, often hinges upon
- Defining your objective(s)
- Devising a plan or strategy to achieve the objective(s)
- Executing the strategy and
- Very importantly, remaining focused on the objective
Devising of a plan/ strategy and execution thereof are matters of expertise in market reading and dealing and are usually the more enchanting part of Risk Management or Trading. Rarely is adequate attention paid to the need to define proper Objectives for the risk management exercise. Even if the objectives have been properly defined, they are often forgotten in the heat of market activity. This leads to failure or underperformance in the big picture. We shall try and illustrate this through some case studies in the context of Corporate FX Risk Management.
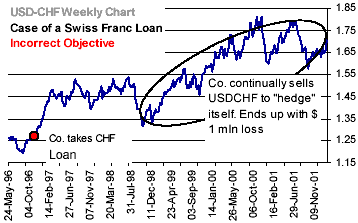
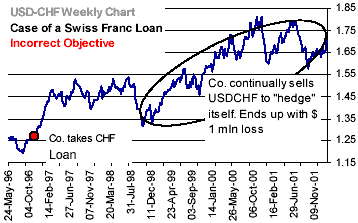 The Case of a Swiss Franc Loan
A company with a Rupee Balance Sheet (take it as a USD Balance Sheet, if you please), contracts a Swiss Franc Loan at a USDCHF rate near 1.25 towards the end of 1996, after which the Swiss Franc weakens to 1.45 by early 1997 and then trades in a range of 1.45-1.55 through the greater part of 1997-1998. It strengthens to about 1.35 by end of 1998.
The company accounts for the Loan in its books at 1.50 and wants to “earn back” the “loss between 1.50 and 1.35” through “Hedging Operations” which call upon it to sell USDCHF in the Forward Market and earn Cash Profits on such Hedges, which will be booked in its Profit and Loss accounts. Note, thatthe focus is on CASH Profits/ Losses generated through “Hedges” and not on the VALUE of the Loan, which is a Balance Sheet item.
The company starts its “Hedging Operations” near the epochal birth of the Euro.
As we all remember, 1999 was the year in which the Euro was born near 1.17against the Dollar and caused much anguish in the market by weakening throughout the year to end just above Parity. In the process it dragged the Swiss Franc down against the Dollar.
The company, to its dismay, found itself making Cash Losses on its “Sell USDCHF” hedges. To make up the initial losses, it sold more USDCHF in ever increasing larger amounts right through the year, trying to earn Cash Profits on interim bouts of Dollar weakness against the Swiss Franc. Huge Sell USDCHF trades were daily entered into for making a few pips profits, not realizing that the trades were all against the larger Trend.
Its focus on the Cash Profit/ Loss made the company overlook the fact that the ongoing weakness in the Swiss Franc was decreasing the value of the Loan on its Balance Sheet.
In an attempt to first earn “hedging profits” and then to cover losses against the trend, it ended up with a USD 1 million loss, negating, to a large extent, the real Valuation Gain on its Balance Sheet.Had its focus been on the Balance Sheet, the company would have stopped its “Hedging Operations” after the first few hedges made Cash Losses and proved that the market was actually reducing the value of its primary Loan exposure!
Sounds incredible? The moral of the story is that a lot of thought and deliberation should go into deciding upon correct objectives before commencing market operations. In a subsequent issue we shall take up the case of a company, which started out with the correct objectives, but lost its focus and underperformed as a result.
Array
In our last report (29-Dec-25, UST10Yr 4.12%) we had said the US2Yr could fall to 3.00%. However, contrary to our expectation, the US2Yr has moved up. The US10Yr has also risen, much earlier than …. Read More
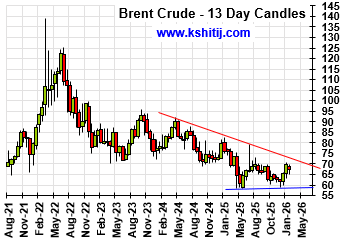
Having risen sharply in Jan-26 to $70.58, will Brent again rise past $70 and continue to rise in the coming months? Or is the rise over and the price can move back towards $60? … Read More
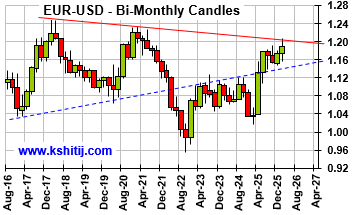
Euro unexpectedly reached 1.2083 in Jan-26 on Dollar sell-off but recovered quickly back to lower levels. Will it again attempt to rise targeting 1.24? Or will it remain below 1.20/21 now and see an eventual decline to 1.10/08? …. Read More
The 10Yr GOI (6.6472%) had risen to a high of 6.78% on 01-Feb. It has dipped a bit from there but has good Support at … Read More
In our 10-Dec-25 report (USDJPY 156.70), we expected the USDJPY to trade within 154-158 region till Jan’26 before eventually rising in the long run. In line with our view, the pair limited the downside to … Read More
Our February ’26 Dollar Rupee Monthly Forecast is now available. To order a PAID copy, please click here and take a trial of our service.
- Kshitij Consultancy Services
- Email: info@kshitij.com
- Ph: 00-91-33-24892010
- Mobile: +91 9073942877


