

Stop Press! Or, why KSHITIJ.COM is reliable
Feb, 22, 2017 By Vikram Murarka 0 comments



 Merriam Webster defines “Quality assurance” as “a program for the systematic monitoring and evaluation of the various aspects of a project, service or facility to ensure that standards of quality are met.”
Over the years, Kshitij.com has been constantly refining its forecasting processes and this has resulted in the reliability of our forecasts increasing from 40% in 2008 to 72% in 2016.
For, at Kshitij.com, we have a very simple understanding of quality. We can know that a bakery is good when the baker serves his own cake at his daughter’s birthday. A barber should be ready to cut the hair of his own son and a tailor’s son should be ready to wear the trouser his father stitches. In simple terms, we have to be ready to use our own analysis and forecasts. And, we ourselves are not all easy to satisfy.
Every step of a report is checked and rechecked multiple times before it can be published but sometimes, even that is not enough for us. Something like this happened recently.
STOP PRESS
A few weeks back we were on the verge of publishing our January 2017 Quarterly Dollar-Rupee forecast. The report was ready to be sent to our Clients. But, something was troubling us. Just when we were going to press the “Send” button on the mail that was to go the clients, we held back for a final check. It was a classic Stop Press moment.
The report had a Sensex/MSCI World Equity Index ratio chart in it (see Chart A below). The chart was bullish, using both classical charting (trend lines) and Elliot Waves. The implication was that Sensex could outperform the MSCI World Equity Index by a monstrous 48% over the next few years. We were excited about sharing this bullish implication with our Clients.
Chart A: Since 2003
Merriam Webster defines “Quality assurance” as “a program for the systematic monitoring and evaluation of the various aspects of a project, service or facility to ensure that standards of quality are met.”
Over the years, Kshitij.com has been constantly refining its forecasting processes and this has resulted in the reliability of our forecasts increasing from 40% in 2008 to 72% in 2016.
For, at Kshitij.com, we have a very simple understanding of quality. We can know that a bakery is good when the baker serves his own cake at his daughter’s birthday. A barber should be ready to cut the hair of his own son and a tailor’s son should be ready to wear the trouser his father stitches. In simple terms, we have to be ready to use our own analysis and forecasts. And, we ourselves are not all easy to satisfy.
Every step of a report is checked and rechecked multiple times before it can be published but sometimes, even that is not enough for us. Something like this happened recently.
STOP PRESS
A few weeks back we were on the verge of publishing our January 2017 Quarterly Dollar-Rupee forecast. The report was ready to be sent to our Clients. But, something was troubling us. Just when we were going to press the “Send” button on the mail that was to go the clients, we held back for a final check. It was a classic Stop Press moment.
The report had a Sensex/MSCI World Equity Index ratio chart in it (see Chart A below). The chart was bullish, using both classical charting (trend lines) and Elliot Waves. The implication was that Sensex could outperform the MSCI World Equity Index by a monstrous 48% over the next few years. We were excited about sharing this bullish implication with our Clients.
Chart A: Since 2003
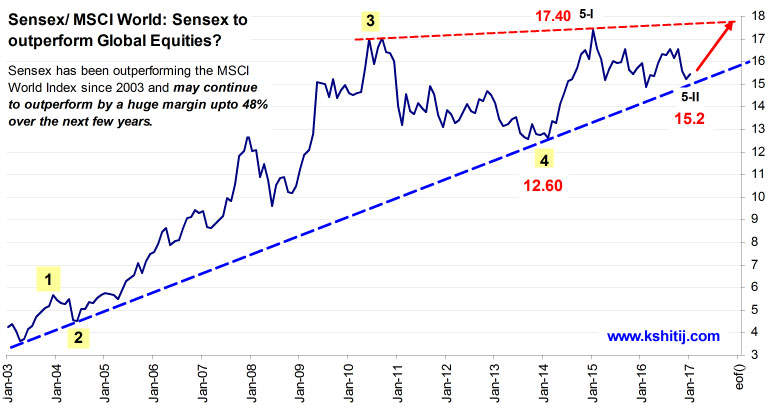
| Elliot Wave projection details: Assuming 5-iii to be at least 138.2% of 5-I gives us 21.83 as the 5-iii top, much above the red trendline, which provides the first resistance/ target near 17.80. If 5-iv retraces 38.2% of 5-iii, then 5-iv may end at 17.73 and a final 5-v may make a top at 22.53, assuming equality between 5-I and 5-v. A rise to 22.53 from 15.2 translates to a huge appreciation of 48.22% over the next few years. |
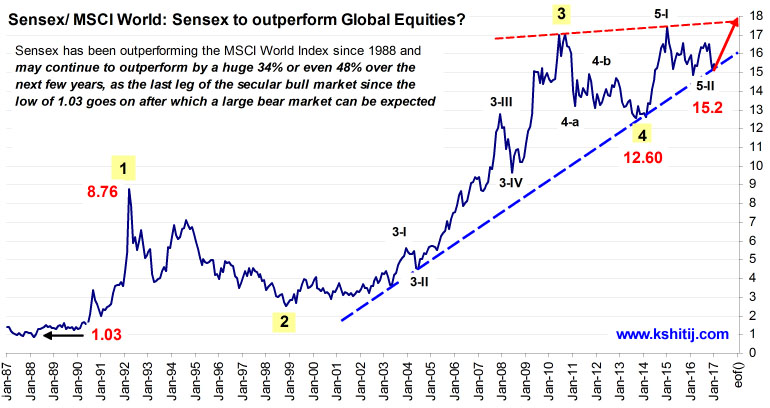
| Elliot Wave projection details: Assuming equality of the large 5th wave to the 1st wave (from 1.03 to 8.76) gives us 20.33 as the initial target, about 34% higher from the low of 15.2. Interestingly, equality of 5-iii to 5-i gives us 20, coinciding with the target of 20.33 seen earlier. This is just a little less than the 22.53 target calculated on the first chart. |

You may also like:


In our 10-Dec-25 report (USDJPY 156.70), we expected the USDJPY to trade within 154-158 region till Jan’26 before eventually rising in the long run. In line with our view, the pair limited the downside to … Read More
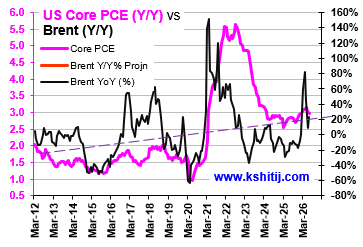
In our last report (04-Sep-26, UST10Y 4.77%) we had noted chances of a slowdown ahead but since Crude could spike up, we retained our view of the US10Yr rising to 5.10% by Nov-26 and 5.40% by Mar-27. As it turns out, Brent did indeed rise to …. Read More
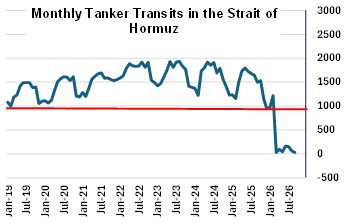
In our September 2026 report (11-Sep-26, Brent @ $103.84), we had expected Brent to range within $90-115 for the next 1year. Prices were expected to remain elevated, primarily driven by the low volume of vessel transit in the Strait of Hormuz. Brent indeed traded within $109.97 and $90.70 in Sep-26, within our expected range. … Read More
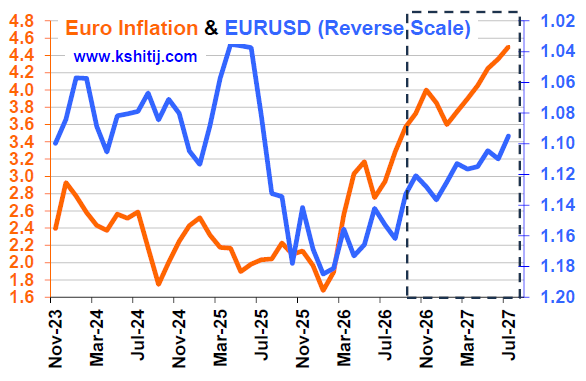
In our September 2026 report (4-Sep-26, EURUSD 1.1620), we revised our Euro forecast upwards due to lack of followthrough selling below 1.14. We expected the Euro to range between 1.1980-1.13 for the next 1yr. However, in line with our earlier bearish outlook, the Euro fell sharply to …. Read More
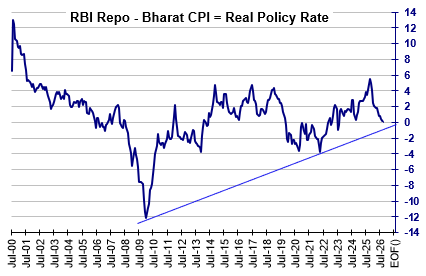
In our 10-Sep-26 report (10Yr GOI 6.98%), we had noted that the Long end of the Curve, viz. the 10Yr GOI was rising due to a number of factors. We said, “Whether the RBI will raise rates on 07-Oct will depend on whether Crude happens to be breaking higher or would have cooled off from $105 to $95” … Read More

Our October ’26 Dollar Rupee Quarterly Forecast is now available. To order a PAID copy, please click here and take a trial of our service.