

followup-in-sterling
Mar, 28, 2004 By Vikram Murarka 0 comments


FOLLOW UP - Bear SHS in Sterling?
In the last issue we had pointed out a three decade old Downtrend Resistance on the GBPUSD Monthly chart, which presaged weakness in GBPUSD. Technical Analysis is based on the assumption that ALL factors governing Price are in the Price itself and we can predict Price movements through the study of Charts. This assumption seems to be proving correct yet again. The Sterling seems to be developing a Bearish Shoulder Head on the Weekly chart (shown alongside), confirming the prognosis of the monthly chart.
If this works, Cable can fall to 1.73-1.70 over the next 4-8 weeks Negation would need a Week Close above 1.8589, as compared to the current level of 1.8158.

You may also like:
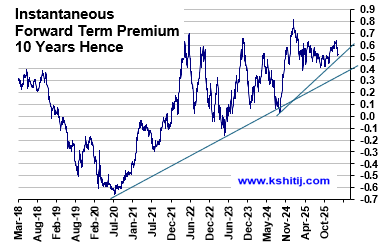
In our last report (28-Jan-26, UST10Yr 4.23%) we had established the linkage between higher Crude and higher Inflation leading onto higher Yields and had said Yields were likely to move up along with …. Read More
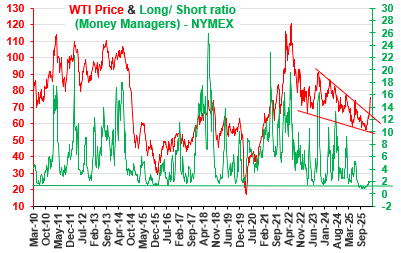
The Net Long short position for WTI has started to move up. Currently above 2, will it rise sharply towards 4-6 and higher or fall back towards 1.5 or lower? The US-Iran conflict has lead to a sharp rally in crude prices. Will it dominate prices in the coming months? … Read More

Our view of a fall towards 1.14 seems to be playing out well so far as the tensions in the Middle East and the US-Iran conflict have triggered a rise in Dollar Index and crude oil prices, thereby weakening to Euro to 1.1507 so far in Mar-26. Will it again attempt to rise targeting 1.20? Or will it remain below 1.19/20 now and see an eventual decline to 1.10? …. Read More
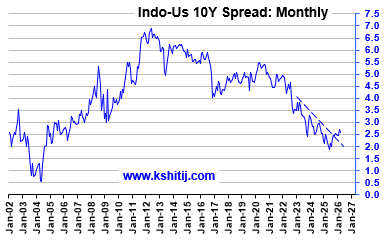
The Real 10Yr Yield at 0.90% plus CPI at 6.2% implies that the nominal 10Yr GOI rate can … Read More

In our 10-Dec-25 report (USDJPY 156.70), we expected the USDJPY to trade within 154-158 region till Jan’26 before eventually rising in the long run. In line with our view, the pair limited the downside to … Read More

Our March ’26 Dollar Rupee Monthly Forecast is now available. To order a PAID copy, please click here and take a trial of our service.