

Can DOW JONES rise 9X times
Apr, 26, 2016 By Vikram Murarka 0 comments


26-Apr-16 Dow Jones @ 17990
 Could we be on the cusp of a gigantic bull run in the Dow Jones? If history repeats itself, the chances would be high.
In the last 115 years, there have been two periods (1906-1921 and 1966-1982) of multi-year sideways consolidation resulting in a huge breakout on the upside, producing two of the three best performing bull markets since 1900.
In this report we look at the possibility of a similar multi-year bull market that could begin as soon as in the next 2-4 months.
Could we be on the cusp of a gigantic bull run in the Dow Jones? If history repeats itself, the chances would be high.
In the last 115 years, there have been two periods (1906-1921 and 1966-1982) of multi-year sideways consolidation resulting in a huge breakout on the upside, producing two of the three best performing bull markets since 1900.
In this report we look at the possibility of a similar multi-year bull market that could begin as soon as in the next 2-4 months.
The really BIG picture
In our Apr ‘16 quarterly Rupee forecast, we wrote, “The last 115 years history of Dow Jones shows two long term sideways consolidation of 15-16 years each (1906-21 and 1966-82), later giving birth to multi-year bull markets. These are shown in the blue boxes in the chart below. A projection of the same duration on the ongoing sideways consolidation since the Y2K top in 2000 gives us the current year 2016 as a possible starting point of a huge secular bull market, possibly from August. This view is unlikely to be shared by most people at this time. But, ongoing below-the-radar technological innovations could come together to create a positive surprise. We would assign this possibility a probability of at least 55-60%. It should not be ignored.”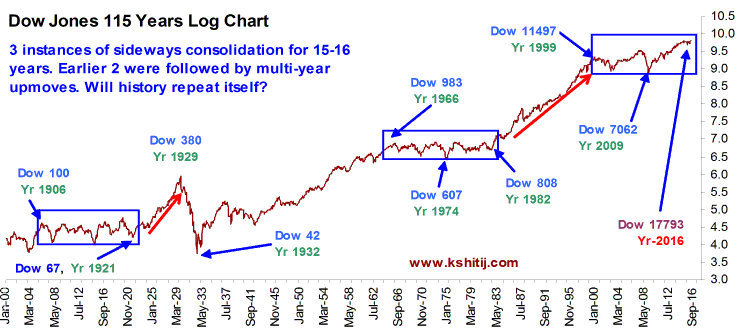 The first consolidation (Jan 1906 – Aug 1921) took 188 months and the second consolidation took 199 months. The current phase that started from Dec 1999 will be 199 months old in June 2016. Allowing for some margin of error, July-August 2016 could be the starting of the next epochal, multi-year bull run.
As mentioned, this might sound improbable to most people given the current preoccupation with low global growth, QE and negative interest rates. Similar despondency might have ruled the popular spirit in the 1920s and in the 1980s (please see the last page of this report). Yet, from the darkest moments have emerged the most brilliant bull markets, as seen above.
Years of prior hard work in solar energy, in electric cars, robotics, genetics, e-commerce and many other fields could be coming to fruition in the coming years. If the Dow were to indeed move up as suggested by the chart above, it could target about 12.00-12.50 on the Log scale. That would translate to a nominal value of 162,750 on the DJIA, compared to the current level 17977, or returns of 9X in the next 10-15 years. For now, we can well target 22500 over the next 12 months.
We are approaching the end of April. People might be preparing to “Sell in May and go away”. That could well lead to a very near term dip. But, we would suggest that people should come back by June-July and start looking around for buying opportunities to participate in what might be the biggest bull market in our life times.
Looking at the above chart, the question to ask is, “Is this the best time to go Short on Human Ingenuity, or would it be better to go Long?” We would like to approach the market from the Long side. The following pages show a few more technical studies to back up our bullishness.
The first consolidation (Jan 1906 – Aug 1921) took 188 months and the second consolidation took 199 months. The current phase that started from Dec 1999 will be 199 months old in June 2016. Allowing for some margin of error, July-August 2016 could be the starting of the next epochal, multi-year bull run.
As mentioned, this might sound improbable to most people given the current preoccupation with low global growth, QE and negative interest rates. Similar despondency might have ruled the popular spirit in the 1920s and in the 1980s (please see the last page of this report). Yet, from the darkest moments have emerged the most brilliant bull markets, as seen above.
Years of prior hard work in solar energy, in electric cars, robotics, genetics, e-commerce and many other fields could be coming to fruition in the coming years. If the Dow were to indeed move up as suggested by the chart above, it could target about 12.00-12.50 on the Log scale. That would translate to a nominal value of 162,750 on the DJIA, compared to the current level 17977, or returns of 9X in the next 10-15 years. For now, we can well target 22500 over the next 12 months.
We are approaching the end of April. People might be preparing to “Sell in May and go away”. That could well lead to a very near term dip. But, we would suggest that people should come back by June-July and start looking around for buying opportunities to participate in what might be the biggest bull market in our life times.
Looking at the above chart, the question to ask is, “Is this the best time to go Short on Human Ingenuity, or would it be better to go Long?” We would like to approach the market from the Long side. The following pages show a few more technical studies to back up our bullishness.
Inflation adjusted price comparison
The inflation adjusted price (“Real”) of the S&P 500 opens up the hidden strength or weakness, not obvious from the normal price, both of which are shown on a Log scale in the chart below.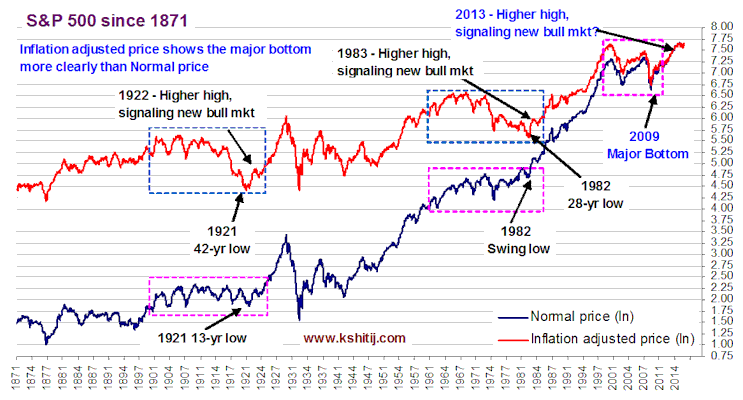 When the Nominal S&P hit a 13 year low in 1921, it was well within the 15-year old (1906-1921) sideways range boundaries but the Real S&P shows it to be a 42-year low, markedly different from the previous lows and a prime candidate for a major bottom. In 1982, the low registered by Nominal S&P was actually closer to the upper end of the 16-year old (1966-1982) sideways range (marked by pink rectangle) but once again, the Real S&P shows it to be the lowest point in 28 years.
Similarly, in 2009, the Nominal S&P hit a 12-year low, but it was a 14-year low for the Real S&P. This can be taken as a major bottom despite the period of 1999-2009 being much shorter compared to the earlier two instances. When seen through the lens of Inflation Adjusted Price, in all the three instances, a multi-decade low has been registered followed by a higher high giving the initial signal of the next bull market.
As the S&P now trades above the 2007 high, there is a possibility that the next major bull run has already started in 2009 and the next up leg can unfold in 2016.
When the Nominal S&P hit a 13 year low in 1921, it was well within the 15-year old (1906-1921) sideways range boundaries but the Real S&P shows it to be a 42-year low, markedly different from the previous lows and a prime candidate for a major bottom. In 1982, the low registered by Nominal S&P was actually closer to the upper end of the 16-year old (1966-1982) sideways range (marked by pink rectangle) but once again, the Real S&P shows it to be the lowest point in 28 years.
Similarly, in 2009, the Nominal S&P hit a 12-year low, but it was a 14-year low for the Real S&P. This can be taken as a major bottom despite the period of 1999-2009 being much shorter compared to the earlier two instances. When seen through the lens of Inflation Adjusted Price, in all the three instances, a multi-decade low has been registered followed by a higher high giving the initial signal of the next bull market.
As the S&P now trades above the 2007 high, there is a possibility that the next major bull run has already started in 2009 and the next up leg can unfold in 2016.
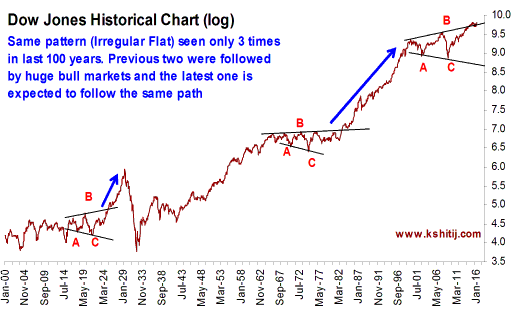
Irregular Flat formations
In Elliott Waves, an Irregular Flat consists of a higher high (marked by red B) and a lower low (marked by red C). Since 1900 there have been three significant instances of this pattern formation, shown in the chart alongside, all of which coincide with the sideways consolidations shown in the earlier page. The last two Irregular Flats (in the 1920s and 1970s) resulted in multi-year rallies and the current instance can also resolve on the upside.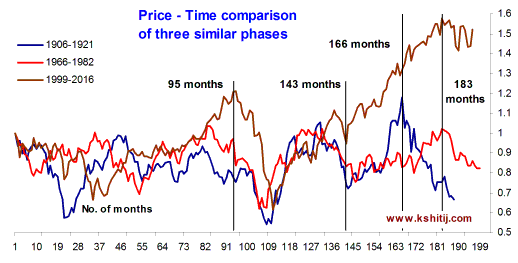
Fractal Comparison
A time comparison of the three periods highlights a strong similarity till about the 143rd month at least. Thereafter, the paths diverge after about the 166th month (14th year). The significant difference between the current period and the earlier two periods is that QE has enabled the DJIA to move up over the last three years. Perhaps QE has enabled some amount of wealth preservation, even if in the hands of a few? Could that provide the essential fuel for the next bull run, if those who have the wealth invest it in the commercialization of the emerging technologies.Socio-economic events
Although we have no delusions about ourselves being historians or sociological experts, we have tried to paint below a broad picture of the things that were happening in the world in the consolidation periods seen in the charts earlier. Was there any commonality that gave rise to the bull markets that took shape afterwards?
You may also like:


In our last report (27-Feb-26, UST10Yr 4.01%), which was published just one day before the start of the US-Israel-Iran War on 28-Feb, we had continued to target 4.60% on the US10Yr based on expectations of higher Crude. At that time, we were looking for Brent to rise …. Read More

The escalation of war between US and Iran throughout March-26 has led to a rally in Brent prices to as high as $119.50, exceeding our bullish targets by a large margin, much ahead of expected time. Will it remain bullish for the coming years?… Read More

Our view of a fall towards 1.14 seems to be playing out well so far as the tensions in the Middle East and the US-Iran conflict have triggered a rise in Dollar Index and crude oil prices, thereby weakening to Euro to 1.1507 so far in Mar-26. Will it again attempt to rise targeting 1.20? Or will it remain below 1.19/20 now and see an eventual decline to 1.10? …. Read More
In our 09-Mar-26 report (10Yr GOI 6.69%) we had warned that the sharp rise in crude due to the US-Iran conflict could push Brent toward $134, which would lift CPI toward ~6.2%, eliminating any chance of RBI easing, and potentially force tightening. This inflation shock, along with higher US yields, was expected to push the 10Yr GOI up to … Read More

In our 10-Dec-25 report (USDJPY 156.70), we expected the USDJPY to trade within 154-158 region till Jan’26 before eventually rising in the long run. In line with our view, the pair limited the downside to … Read More

Our March ’26 Dollar Rupee Monthly Forecast is now available. To order a PAID copy, please click here and take a trial of our service.