Author Archives: Vikram Murarka

About Vikram Murarka

Chief Currency Strategist at KSHITIJ.COM. Likes to look at the markets from many different angles. Weaves many conventional and unconventional technical analysis techniques and fundamental analysis into a global macro perspective. Likes to take the road less traveled.

Static or Dynamic Benchmark

The Need for Dynamic rather than Static Benchmarks

Very few companies have adopted a formal plan or strategy for managing FX Risk. Amongst the few that have, most work on the basis of a fixed (static) benchmark for the whole year. We think Benchmarks need to be Dynamic, rather than Static.

Static or Dynamic Benchmark

The need for a Benchmark

A benchmark is needed in Risk Management for two reasons:

  • It acts as a guide for the Risk Manager
  • It is a number by which to judge the effectiveness of the Risk Management function

In contrast, a benchmark is not needed in accountancy because (a) accounts do not recognize Risk (b) it is not the job of accounts to provide direction and (c) the profit/ loss is just the difference between the rates that existed when an exposure came into being and when it was retired.

Essentially, a Benchmark rate is like a Budget rate. The Budget rate has no recognition in accountancy, but is an essential tool for management efficiency.

Construction of Benchmark should incorporate past as well as future

A benchmark could be based entirely on the past (for instance, what was the average rate in the past 1-3-6-12 months) or it could be based totally on the future (a forecasted rate or range). On the one hand, the rates in the future are unlikely to remain static at the rates of the past. On the other the future emanates from the past. As such we think it should be a mix of the two.

We have proposed a Benchmark (used in the monthly benchmark workings that we send to Clients) that takes important guidance from the past, but also considers a range of possibilities for the future. Ultimately, Risk Management has a lot to do with trying to anticipate and prepare for/ insulate from the future.

The objective of the Risk Management function would be to meet the Benchmark, because in so doing, it would ensure that all the possibilities have been met. If the benchmark can be bettered, of course that would be much more desirable.

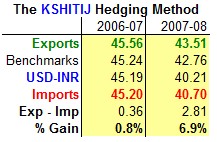
Look at the chart below. Here we have tracked the Average of Monthly Dollar-Rupee Benchmark Rates set by us in 2006 against the actual movement in Dollar-Rupee. As can be seen, if an Exporter had been able to achieve the Benchmarks (as seen in the chart), he would have been able to capture a good part of the upmove in the Dollar in the early part of 2006.

Actual usdinr vs benchmark rates

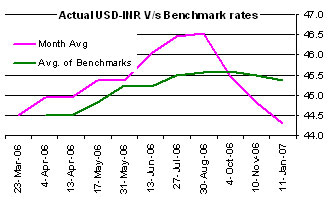
Tracking the above Dynamic Benchmark would have been better than pegging Exports at, say, 44.50, the rate that prevailed in Apr-06, when the annual budgeting exercise may have been done.

This brings us to our most important proposition:
Should the Benchmark be static? Or dynamic? In some manners it can be said that a Benchmark, by nature, should be static. Else, how can it be relied upon to serve as a guide or be used to evaluate performance? We suggest, however, that the Benchmark should be dynamic because they allow the Risk Manager to address changing market conditions.

Consider this: is it not that Benchmarks are reset at least once a year? In that sense, they are not absolutely static, but are in fact, dynamic, across years. This idea is commonly acceptable. It is acceptable because it is accepted that every year brings a fresh outlook on the markets. Building upon this, when we know that the market conditions can change dramatically even within a year, we would be ready to accept the idea of a Benchmark that is updated within the year also.

If so, what remains to be decided upon is the periodicity with which the Benchmarks should be updated. We propose that they be reset Monthly.

The next objection to a Dynamic Benchmark is a little more vexing. How can a Benchmark, which itself changes, be used to evaluate performance?

Our answer to that is:
To calculate P/L all that is needed are two rates. The calculation of the P/L is not the difficulty at this stage. The conceptual problem lies with the very change in the Benchmark.

Since the Benchmarks are to be reset on a monthly basis we should take the average of the benchmarks set in the last 12 months as the Rate/ Number to evaluate performance against. Thus, the Benchmark could both serve as an effective guide under changing market conditions as well as be used to evaluate performance.

The Purchase department and Sales departments in a company have quarterly or even monthly reviews and targets that are reset every time.

Why should the same concept not apply in Forex Risk Management, which basically involves either buying FX for Imports (the work of the Purchase department) or selling FX against Exports (the work of the Sales department)?

Think about it.

Write back to us with your views and questions!

Sensex Log Chart

A Review – Born Again Sensex Bulls. (Jan-06)

Sensex: 19058.67

Recap

22 moons ago, on 20-Jan-2006 , when the Sensex was 9311, we had said that “..although the Sensex has risen 300% since April-2003, there could still be a lot of room on the upside, if history is to repeat itself, and the current Bull Run may, in fact, be in its infancy”. For those who missed that report, it is available at http://colourofmoney.kshitij.com/born-again-sensex-bulls/

The market has risen another 100% since then, even after the terrible May-June 2006 fall, and the Sensex has closed above 19000 today. We thought it would be appropriate to take a fresh look at the charts.

Where to now?

The “Sub-Prime” crisis in the US a couple of months ago had brought the world to the brink of, possibly, the worst financial disaster since 1929. But, then Super-Fed came to the rescue. Underscoring the overriding influence of the US Federal Reserve on the markets, almost all financial markets bottomed on 17-Aug, the day the Fed cut its Discount rate by 50 bps to 5.75%. The Sensex too bottomed on the same day, after hitting a low of 13779.88. The rally gained further wings after the Fed cut the Fed Funds rate, again by 50 bps, to 4.75%, on 18-Sep . The Sensex has rallied 21.62% in 18 sessions since then.

Please take a look at the daily Log Chart below. The Sensex is seen to have been moving up inside an upward sloping channel marked AA and BB, connecting the peaks at 6249.60 (Jan-04) and 12671.11 (May-06). It is now close to the upper end of this channel, with Resistance near 19800–20000 . Given the sharp upmove in the last few days, and the importance of the Resistance, it is time to be cautious and book partial profits on 16-22 month old Long positions. Although we don’t want to become outright bearish given the massive inflows into Emerging Markets, the charts ask us to be prepared for 16000-15000, a 15-20% correction.

What could trigger a correction? We don’t know. But, the answer could, perhaps, once again lie with the US Fed , which is scheduled to meet on 31-Oct. At the moment, our view is that Fed will not cut rates unless the global stock markets “misbehave”. But, a “no further rate cut” by the Fed could take the wind out of the markets’ sail triggering a correction. Or it could be the soaring Crude prices.

Either way, this Deepawali, it might pay to have some cash in the bank.

Sensex Daily Log Chart

Long-Term forecast for Crude in 2008 and Dollar-Yen discussion

Nymex Crude, Feb Futures: $92.69

Crude Oil futures have been in a bull market for the last 9 years, rising 867% from a low of $10.35 (Dec-98) to a high of $100.09 (Jan-08). In such a situation, it is imperative that one does proper risk-reward analysis. We try to anticipate Crude’s behavior in 2008, especially since USA, the world’s largest consumer of Crude, stands on the cusp of a recession. Take a look at the continuous monthly chart of the near-month Nymex Crude Futures:

Crude Monthly 5 Wave Upmove

Trend Line Analysis

The RED trendline on the chart above, joining the highs of $39.99 (Feb-2003), $70.85 (Aug-2005) and $99.29 (Nov-2007), provides resistance near $100.00-102.00. This trendline might not break in the first few months of 2008. As such, Crude can target $85.00 in the next 6-months and $75.00 further out, as shown by the BLUE arrow above. The target of $75 falls on the GREEN trendline, drawn from the low of $26.65 in Sep-2003.

Elliot Wave Analysis

The chart above shows a remarkable 5-wave pattern over the last 9 years. Wave-1 is traced from a low of $10.35 (Dec-98) to a high of $37.79 (Sep-00), a rise of 270% in just 21 months. The corrective Wave-2 extended from the high of $37.79 (Sep-00) to a low of $17.12 (Nov-01). This was a 54% decline, in a period of 14 months. Importantly, this decline occurred after the “dot-com” bubble burst in early 2000 and the US went into a recession in 2001, emphasising the importance of US demand for Crude prices.

Wave-3 lived up to its reputation of being the biggest friend of bulls. Prices rose from the low of $17.12 in Nov-01 (post 11-Sep-01) to $77.95 by Jul-06, a whopping 355% rally in 57 months. This bull run even overcame the massive hurricanes, Katrina and Rita, of 2005.

The 4th Wave was the shortest in terms of time, but the most brutal in terms of price. From a high of $77.95 in Jul-06, Crude fell sharply to a low of $49.90 in Jan-06, a decline of 36% in just 6 months. From there, the final Wave-5 has extended to a high of $100.09, see on 03-Jan-08.

However, Wave-5 has run into the RED trendline shown above. As such, we may now see an ABC correction, targeting $75, as depicted by the BLUE arrow above. The chances of a US recession could work to further support the Bear case.

Crude Oil Weekly Candles

We now magnify the period from May-05, by looking at the Weekly chart.

The RED trendline on the chart above, joining the highs at $75.35 (Apr-06), $77.45 (June-06) and $99.29 (Dec-07) , provides resistance in the $100-$102 region. Note, however, the GREEN trendline on the downside. This has been coming up since Aug-2007, and now provides support near $92.00. Thus, while $92.00 holds on the downside, there could be a final dash in Crude towards $100.00-102.00 in the next 4-5 weeks, where the trendlines are converging (circled area above) in the chart above. Alternatively, should $92.00 break immediately, Crude may trade within $96.00 – $86.00 for the next several weeks.

DOLLAR-YEN @ 106.00… A small bounce to 110?

USDJPY vs 10TBond JGB DiffDollar-Yen is trading at its lowest level since 2004, threatening to test the 2004 Low near 101.68. What are Interest rates saying about the currency rates?

The chart alongside shows the USDJPY exchange rate (RHS) juxtaposed on the 10-Yr Bond-JGB yield differential (LHS).

The differential (currently 2.31%) is close to the lowest level it has seen several times since 1995. This suggests that the differential could increase (bounce back) in the weeks/ months ahead. But, is this possible in the current environment where the US is facing recesssion and the market is factoring in a 75bp cut in January and possibly more in the months ahead?

USD TBond Yields since 2002 USD T-Bond 10-5yr Yld Differentials since 2002
Note that the US-10 Yr Bond Yield is near 3.75%. It could dip by maybe 20bp in the foreseeable future, even if the Fed rate falls by 75 bps. This is consistent with the overall curve steepening that we are seeing in the USA right now. The “curve steepening” can be seen in the chart above. The 10-5 Yr Bond Differential has chances of rising further towards 0.85% as against the current differential of 0.70%. 

JGB Yields since mid-2003Now let us take a look at the JGB Yields. The 10-Yr JGB Yield, currently near 1.43%, can dip to 1.25-1.20%, to touch the RED trendline in the chart alongside.

Thus, even if the US 10-Yr dips to 3.55% and the JGB 10Yr dips to 1.25%, the Bond-JGB Differential will remain steady around the current 2.30. Please refer again to the chart of the US Bond-JGB Yield Differential versus the USD-JPY rate, shown on the top. It may be noticed that the USDJPY rate has recovered/ bounced whenever the Yield Differential has come down to the 2.37-35% region, as depicted by the Red Trendline in that chart.

USDJPY WeeklyLittle reason, therefore, to sell the USDJPY aggressively near current levels. Admittedly, the long-term trendline joining the lows of June 1995, Jan 2005 and Nov 2007, as seen in the chart alongside, has been broken today. However, we need to wait through this week, possibly the next also, to assess whether or not it is a false break. History and evidence suggests that there could be a small bounce in Dollar-Yen to about 110 over the next 1-6 months. However, a subsequent fall, even past 106 cannot be ruled out.

Risk Management

Focusing on the Currency Risk Management Process in the Corporate sector

Good to be with you again, Gentle Reader! This issue talks about:

  • The need for focusing on the Currency Risk Management Process in the Corporate sector

Please keep those comments coming. We love ‘em!

Focusing On The Wrong Problem?

“RBI bars exotic forex products”. This headline in the Business Standard on 07-Feb-08 had the entire forex market in a tizzy. The report said that following losses of Rs 1000 Cr (about $253 mln) stemming from complex forex derivatives, the RBI has directed banks to sell only plain vanilla rupee-dollar derivative products for hedging corporate forex exposures, not for trading.

Business Standard News Clip

Although the ban has not been confirmed, the reactions to the headline have centered around whether or not the RBI has been justified in calling for a ban in the first place. Opinions have ranged from “Yes, it was justified” to “No, it wasn’t” to “Don’t know really.” Some voices, including ours, have called for greater education for the Buy side (Corporate sector) of the market.

Focus on Process missing

Hedging PolicySo far, the discussions have focused on the derivative “products” – whether or not they should be banned; and whether there is a need for greater education regarding these “products”. Ironically, there has been no talk about the need to strengthen the very process of corporate FX risk management .

Of course, it is to be acknowledged that on the insistence of the RBI, many companies have adopted a Currency Risk Management policy at the board level. However, a policy is not the same as a process.

While a “policy” is more philosophical, outlining the overall guiding principles of an activity, a “process” is more practical, involving itself with the nuts-and-bolts issues of the day to day performance of the activity. And derivative “products” are something else altogether. They are merely the instruments used to implement the objectives of the hedging policy and process.

The global currency market has traditionally been driven by the “Sell Side” i.e. Banks. It is a testimony to the salesmanship of the Sell Side that the Buy Side has, quite often, been charmed into buying derivative products, without adequately evaluating their suitability. As in the case of any other product, while buying a derivative, it should be seen whether the product serves the overall objectives of the Customer.

Hedging Process needed

Herein lies the need for a Hedging Process, as outlined below. Notice that “Which product to use” is only one out of the seven questions that a Hedging Process is intended to answer. As can be seen, the overarching emphasis on derivative products leads to a neglect of the other equally vital aspects of a complete hedging process.

Hedging Process is more practical in nature. It provides answers to the following questions:

  • What to hedge?
  • How much to hedge?
  • When to hedge?
  • For what period to hedge?
  • How to hedge?
  • Which product to use?
  • Why are we hedging in the first place?
  • How do we measure performance?

Vital Questions

How does one go about formulating a Hedging Process? We suggest a set of questions that every Corporate FX Risk Management Team can ask itself. The answers to these questions will pave the way for the formulation of a Hedging Process for the company.

  1. What is our FX Risk Management Agenda for 2008?
  2. Have we quantified our FX Risk Management Objectives for 2008?
  3. The production and marketing guys have their budgets. Have we worked out a Hedging Cost Budget?
  4. How do we measure FX Risk Management performance? Are we trying to beat the market, or better a Benchmark?
  5. Is our Benchmark based on the past, present or future? Where does Risk lie: in the past, present or future?
  6. The market is ever changing. Is our benchmark fixed? Or Dynamic?
  7. Are we more concerned with the performance of our Hedges than of our Exposures? Why?
  8. What are the five greatest Risk Management challenges we face?
  9. What three wishes would we want to ask of the Treasury Fairy?
  10. Are we willing to explicitly pay for Advice? Should advice be paid for separately from the commission/ brokerage payable on hedging transactions?

Is it worthwhile?

Is it worthwhile taking the trouble to answer these 10 questions and formulating a 7-step Hedging Process? The results of the KSHITIJ Hedging Method, a complete, end-to-end hedging process, suggest it is.

The Kshitij Hedging Method 06-07Under the method, Exports have been covered at an average rate of 45.56 and 43.51 in 2006-07 and 2007-08 respectively, while Imports have been covered at averages of 45.20 and 40.70 in the same periods. Thus, a corporate having both Exports as well as Imports has been able to earn a hedged Export-Import margin of Rs 0.36/ USD, or 0.8%, in 2006-07. This margin increased dramatically to Rs 2.81/ USD, or 6.9%, in 2007-08.

The KSHITIJ Hedging Method, which is centered around a revolutionary concept of Dynamic Benchmarks has enabled both Exporters and Importers to make money simultaneously. Importantly, this has been achieved without resorting to speculation or trading, even while being hedged to the extent of 60%.

The secret in the KSHITIJ method is that it addresses all the aspects of a complete Hedging Process. Derivative products have certainly been used, but merely as instruments, as and when needed, to achieve the objectives of the Method. To reiterate, the focus needs to shift to the overall FX Risk Management objective, and not be confined to the derivative products.

Once a person starts taking care of his health, he will automatically cut down on cigarettes and junk food.

GBPUSD: Choosing a Put Option

How paying Option Premium can actually be profitable

It is an open secret that every Corporate Hedger wants to pay no more than Zero for an Option that he buys. Banks oblige by constructing “zero cost” strategies. The concept of zero cost structures has become so ingrained in the general psyche of the market that when, at a seminar, we suggested buying Call Spreads at a cost, an experienced Hedger asked, “But, aren’t Call Spreads supposed to be zero cost!” As if that is a cast-in-stone rule.

Like anyone else, we would love to be able to buy cheap Options. However, at the same time we are open to the idea of not only paying premium, but also the idea of paying higher premium, if there is an opportunity to make greater profits thereby. If this sounds strange, perhaps this trade example will illustrate.

GBPUSD- Choosing a put option

In-the-Money Put Option

The GBP-USD was trading near 1.9690 on the morning of 04-Jan-08 , looking to fall towards 1.95 over a 1-month period and possibly towards 1.90 over 3-4 months. While an eventual fall looked pretty certain, an interim rally towards 1.98-99 could not be ruled out.

The idea, therefore, was to buy a Put Option, rather than to sell GBPUSD Forward. But, the Strike rate and the tenor needed to be figured out. We evaluated a combination of two strikes and two tenors.

Choosing Strike & Tenor on a GBPUSD PutBoth the strikes we evaluated were In-the-Money, at 2.0050 and 1.9850, as compared to the then At-the-Money-Forward rate of 1.9674 (Spot being 1.9690) for 1-month. The tenors considered were 1-month and 2-months. The cost and breakevens for each are given in the table alongside. We eventually decided to buy a GBPUSD Put, Strike 2.0050 for 1-month. This was despite the fact that the Premium (0.0466) for the 2.0050 1-mth Put was higher than those for the 1.98 1-mth and 1.98 2-mth Puts. The deciding factor was the Breakeven, which at 1.9584 was the highest for the combination we chose.

Better Off

As it turns out, our currency view proved to be correct and GBPUSD fell to 1.9520 by 11-Jan, just a week after we bought the 2.0050 Put. We did a position review. The Vols had fallen from 9.85% on 04-Jan to 9.08% on 11-Jan. Thus, we were making money on the currency (GBPUSD had fallen 0.86%) as well as on the Vols. At the same time, we had not lost a lot of time-value, because our initial target of 1.95 had been more or less achieved in just 7 days. We decided to unwind.

Comparing profits on different StrikesWe had made a profit of 107 pips against an initial cost of 466 pips, a return of 23%. This was higher, both in pips as well as percentage terms, than what we would have made had we bought a 1.98 Put where we would have paid a smaller premium of 300 pips. Cheap (and Zero Cost) Options are not necessarily the only way to be profitable.

Sometimes it pays to pay more because you can end up making more!