

Can Rupee REER fall with Nifty PE?
Apr, 05, 2018 By Saandhy Ganeriwala 0 comments

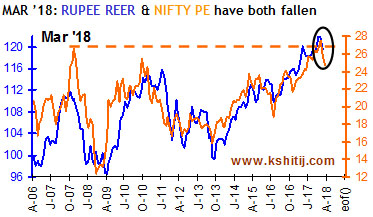 We asked the above question in Dec ’17. The chart of Rupee Real Effective Exchange Rate (REER) and Nifty PE evolved since then, as below:
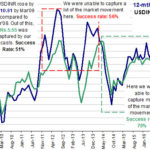
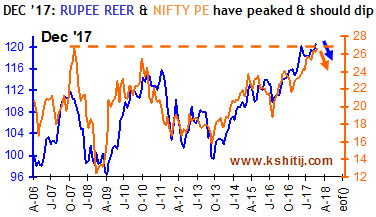 Nifty PE had reached 26.6, which was near the peak last seen in the 2007 market top. Hence, we were unable to be bullish on Nifty PE any more. Moreover, the strong correlation between Rupee REER and Nifty PE (especially seen to be strong near peaks) meant that we were expecting Rupee REER (122.57 in Dec ’17) to be dragged lower with Nifty PE in 2018.
 Our view was proven correct. Nifty PE has seen a rather steep fall to 25.68 (Feb ’18) and 24.66 (Mar ’18). Along with it, Rupee REER has indeed been dragged lower from 122.57 in Dec ’17 to 119.51 in Feb ’18.
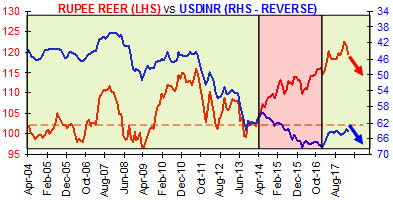 The REER of Rupee tells us how much the market rate for Rupee deviates from its fair value. An REER value above 100 implies that the market rate is overvaluing the Rupee, while a value below 100 indicates undervaluation. Hence, a fall in REER implies that the Rupee’s overvaluation has decreased ie the Rupee has weakened. The green zones in the adjacent chart highlight the close correlation between Rupee REER and USDINR (inverse).
After a phase of divergence between 2014 and 2016*, the correlation has returned.
*This suggests that the Rupee did not weaken as much as it should have during 2014-16.
The REER of Rupee tells us how much the market rate for Rupee deviates from its fair value. An REER value above 100 implies that the market rate is overvaluing the Rupee, while a value below 100 indicates undervaluation. Hence, a fall in REER implies that the Rupee’s overvaluation has decreased ie the Rupee has weakened. The green zones in the adjacent chart highlight the close correlation between Rupee REER and USDINR (inverse).
After a phase of divergence between 2014 and 2016*, the correlation has returned.
*This suggests that the Rupee did not weaken as much as it should have during 2014-16.
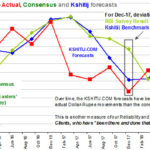
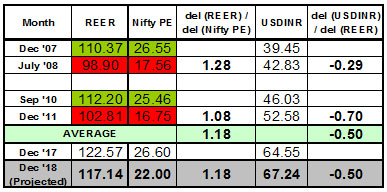 In the adjacent table, we make indicative projections for REER, Nifty PE and USDINR on the basis of past examples, when steep falls in Nifty PE led to a drop in Rupee REER and a rise in USDINR. We project that if Nifty PE falls to 22 by Dec ’18, we could see USDINR rise to 67.
You can view our Economic Calendar with the current chart here.
In the adjacent table, we make indicative projections for REER, Nifty PE and USDINR on the basis of past examples, when steep falls in Nifty PE led to a drop in Rupee REER and a rise in USDINR. We project that if Nifty PE falls to 22 by Dec ’18, we could see USDINR rise to 67.
You can view our Economic Calendar with the current chart here. 
Saandhy Ganeriwala
Saandhy is a postgraduate in Economics, but like all good market-men, he seeks confirmation from technical analysis charts for his macroeconomic ideas. His research is a good mix of charts, stats and econ. Apart from that, he calls himself a news junkie and an occasional writer.
You may also like:
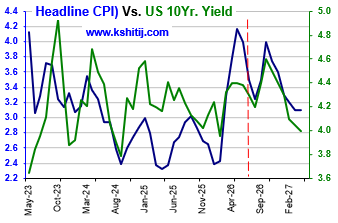
For the last few months we have been looking for Crude to rise towards $130-190 and pull up the US CPI towards 4.6% and the US10Yr Yield to 5.4% by Jan-27. This view has clearly gone wrong with Brent falling sharply below $90 as a result of the US-Iran peace deal, which is the …. Read More
In our June 2026 report (1-Jun-26, Brent @ $95.47), we had expected Brent to correct to $88 before bouncing back to $120 and $145 by Aug-26 and Sep-26, respectively. A sustained trade below $90 was said to be incumbent on a fully credible resolution of the US-Iran war. … Read More
In our June 2026 report (10-Jun-26, EURUSD 1.1546), we expected the Euro to rise towards 1.17 in Jun-26 before reversing lower, with surging crude prices, rising inflation, and potential central bank rate hikes posing key risks amid the ongoing US-Iran conflict …. Read More
In our last report on 03-Jun-26 report (10Yr GOI 7.03%) we remained bullish on Brent and therefore called for higher CPI and higher Yields. At the same time, we said, “Our view will come under threat if Brent trades … Read More

In our 10-Dec-25 report (USDJPY 156.70), we expected the USDJPY to trade within 154-158 region till Jan’26 before eventually rising in the long run. In line with our view, the pair limited the downside to … Read More

Our July ’26 Dollar Rupee Quarterly Forecast is now available. To order a PAID copy, please click here and take a trial of our service.