


How much of the market movement do our forecasts capture?
Feb, 12, 2018 By Saandhy Ganeriwala 0 comments


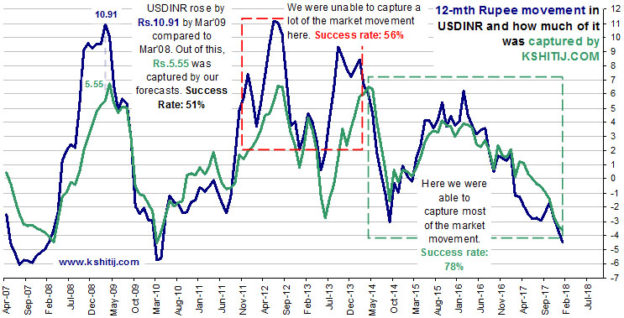
How much can you rely on our Dollar-Rupee forecasts? One way we answer that question is by measuring and tracking our Reliability over time. Incidentally, we are the only forecasters to publish an 11-year reliability track on its website.
Another way to assess that is to ask, “If Dollar-Rupee moves “x” Rupees in one year, how much out of that “x” is captured by our forecasts?”
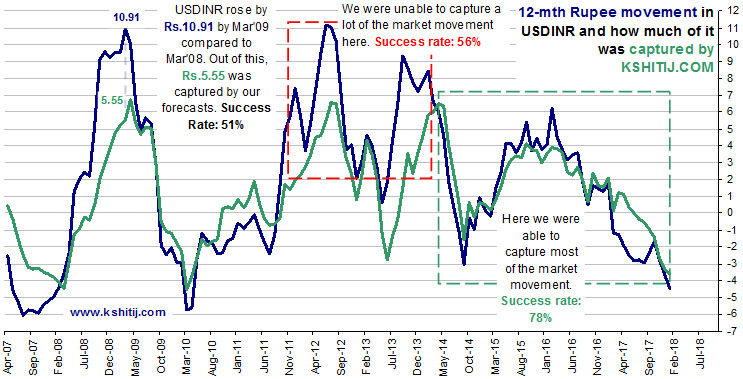
The blue line charts how many Rupees USDINR has moved over the previous 12 months. The value corresponding to Mar-09 is 10.91. This means that USDINR moved up by Rupees 10.91 between Mar ’08 (40.35) and Mar-09 (51.26). As against this, the green line says that we were able to predict Rupees 5.55 of the upmove. In other words, our forecasts were successful in capturing Rupees 5.55 (51%) out of the actual movement of Rupees 10.91.
How does that work? After Mar-08 (when USDINR was 40.35) and till Mar-09 (when USDINR was 51.26), we made 12 forecasts for the price which was expected to prevail in Mar-09. The average of these 12 forecasts was 45.90, compared to the actual 51.26 that prevailed in Mar-09. Thus, we predicted a movement of Rupees 5.55 (45.90 – 40.35) in USDINR over this 12 month period, as compared to the actual movement of Rupees 10.91 (51.26 – 40.35). This captured movement of Rupees 5.55 is shown by the green line on the graph.
We didn’t meet our own expectations from Dec’11 to Feb’14 when the median gap between blue and green was approximately 3.21 points (median proportion of actual movement captured in this period was 56%).
However, over the years we have tried to improve our forecasting capabilities and consequently, the results for the period Mar’14 to Dec’17 have shown a marked improvement – the median gap reduced to -0.19 points. In other words, median proportion of the actual Dollar-Rupee movement captured by our forecasts was 78%. It is our aim to increase the “captured” movement from the current 78% to at least 85% over time.
We ask very hard questions about our performance to ourselves, well before any of our Clients do. And we try and answer the question very objectively. This is a necessary first step to ongoing improvement and results in increased reliability of our forecasts for our Clients.
View our February Economic Calendar with the current chart.

Saandhy Ganeriwala
Saandhy is a postgraduate in Economics, but like all good market-men, he seeks confirmation from technical analysis charts for his macroeconomic ideas. His research is a good mix of charts, stats and econ. Apart from that, he calls himself a news junkie and an occasional writer.
You may also like:



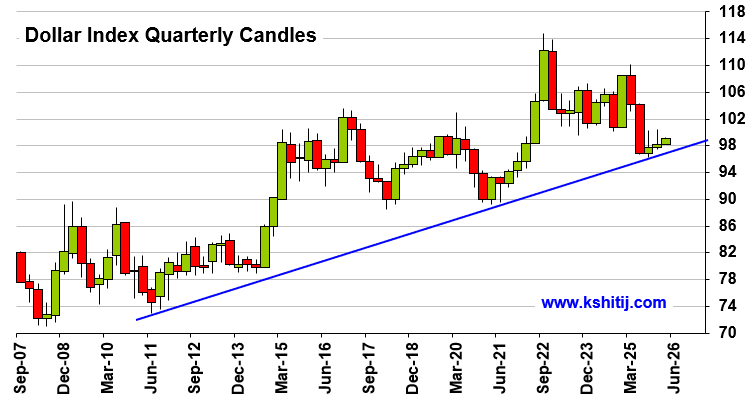
In our 10-Dec-25 report (USDJPY 156.70), we expected the USDJPY to trade within 154-158 region till Jan’26 before eventually rising in the long run. In line with our view, the pair limited the downside to … Read More
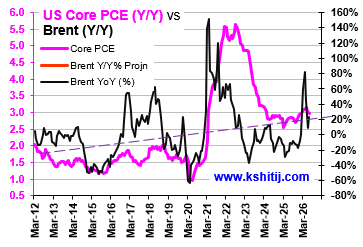
In our last report (04-Sep-26, UST10Y 4.77%) we had noted chances of a slowdown ahead but since Crude could spike up, we retained our view of the US10Yr rising to 5.10% by Nov-26 and 5.40% by Mar-27. As it turns out, Brent did indeed rise to …. Read More
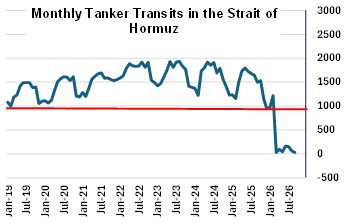
In our September 2026 report (11-Sep-26, Brent @ $103.84), we had expected Brent to range within $90-115 for the next 1year. Prices were expected to remain elevated, primarily driven by the low volume of vessel transit in the Strait of Hormuz. Brent indeed traded within $109.97 and $90.70 in Sep-26, within our expected range. … Read More
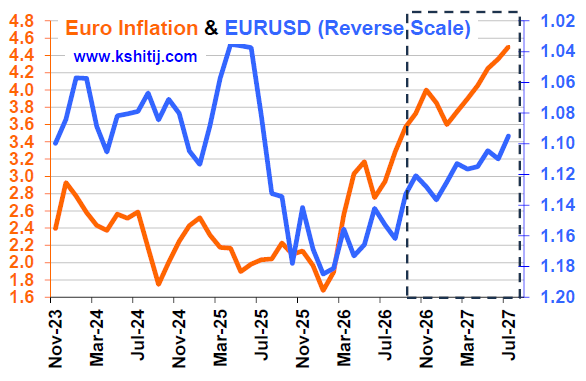
In our September 2026 report (4-Sep-26, EURUSD 1.1620), we revised our Euro forecast upwards due to lack of followthrough selling below 1.14. We expected the Euro to range between 1.1980-1.13 for the next 1yr. However, in line with our earlier bearish outlook, the Euro fell sharply to …. Read More
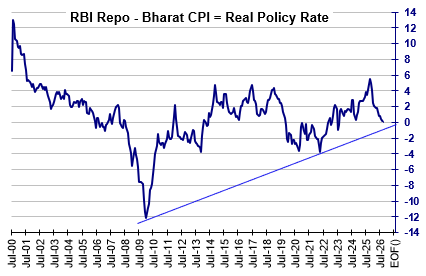
In our 10-Sep-26 report (10Yr GOI 6.98%), we had noted that the Long end of the Curve, viz. the 10Yr GOI was rising due to a number of factors. We said, “Whether the RBI will raise rates on 07-Oct will depend on whether Crude happens to be breaking higher or would have cooled off from $105 to $95” … Read More

Our October ’26 Dollar Rupee Quarterly Forecast is now available. To order a PAID copy, please click here and take a trial of our service.