

Yield Spreads and Currencies
Oct, 23, 2017 By Vikram Murarka 0 comments

WHAT IS THE ONE FACTOR TO WATCH FOR IN CURRENCIES?
There seem to be so many variables that impact currencies, so much news and data releases to follow, so much to keep track of, that it is easy to get overwhelmed. The more seasoned people talk about Inflation and Central Bank action. But, even these give little information because they do not change on a daily basis. Inflation data, for instance, is available only on a monthly basis and even then with a lag. So, the question is, what are the main factors that impact currency markets? Is there any one main factor to definitely watch while trading currencies?
We should always take a look at the direction of the Spread between the yield on US Treasury Bonds on the one hand and that on bonds of other countries. These Yield Spreads often have a very high correlation with currencies. Here we look at how these Spreads work for the three major currencies, the Euro, Yen and Pound.
 FOR EUR-USD
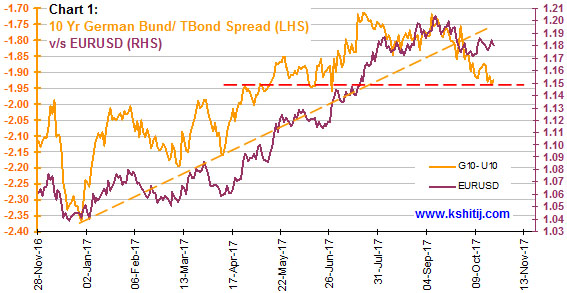
While watching the Euro-Dollar, we should always check the trend in the Yield Spread between the 10Yr German Bunds and 10Yr US T-Bonds (German 10Yr – US 10Yr), plotted on the left hand axis of Chart 1 alongside. This has a strong directional correlation with the Euro-Dollar rate, plotted on the right hand axis.
The Spread has risen from -2.37% (Jan ’17) to -1.72% (6th Sep ’17) as German yields rose faster than US yields in that period. This was accompanied by a rise in the Euro-Dollar from 1.0405 to 1.2035 on a trend basis. The up-down undulations in the Spread along the way have also been mirrored in the Euro-Dollar rate.
Looking ahead, there is a possibility that the uptrend in the German-US Yield Spread since Jan ’17 may have been broken. The earlier uptrend in the Euro-Dollar since Jan ’17 has also stalled along with the fall in the German-US Yield Spread from -1.72% (6th Sep ’17) to -1.93% now. A break below -1.95% on the Spread would confirm the break of the uptrend. If that happens, the Euro would be vulnerable to a break below 1.17.
 FOR USD-JPY
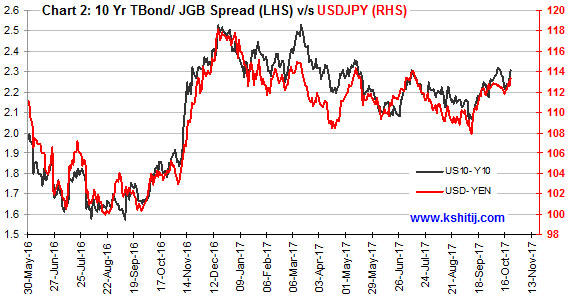
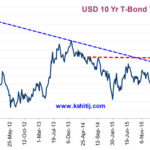
Similarly, there is a strong correlation between the 10Yr US T-Bond / 10Yr JGB Yield Spread (US 10Yr – JGB 10Yr, left hand axis) and Dollar-Yen (right hand axis) on Chart 2 alongside.
There was a sharp rise in the Spread from 1.57% (Sep ’16) to 2.51% (Dec ’16) which was accompanied by a rise in Dollar-Yen from 100.40 to 117.89. The
Spread has been ranging sideways between 2.51% and 2.06% thereafter, with a slight downward bias, which has been reflected in the slow appreciation of the Yen from 117.89 (Dec ’16) to 107.84 (6th Sep ’17). More recently, the Spread has been moving up again to a level of 2.31% now, and Dollar-Yen too has risen to 113.30 along with it.
We have to now see whether the Spread will move up further towards 2.35-2.40% or higher. If so, Dollar-Yen might move up towards 115+.
 FOR GBP-USD
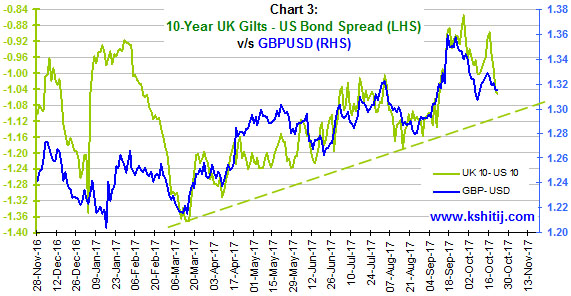
Chart 3 plots the Spread between the 10Yr UK Gilt and 10Yr US T-Bond yields (UK-US) on the left hand axis and the Pound-Dollar rate on the right hand axis.
Here too we see the strong correlation between the Spread and the exchange rate, especially since March 2017, except for a brief period in May.
Going forward, the Spread (currently -1.052%) could come down further towards -1.11%. If so, it could pull the Pound (currently 1.3149) down towards 1.30. Thereafter, if the Spread bounces from the trendline Support near 1.11%, the Pound too might be able to find Support near 1.30.
GOING DEEPER
To go deeper, we can try and study the trends in the individual Yield charts – the US T-Bonds, the German Bunds, the Japanese JGBs and the UK Gilts – and try and see where they are each going separately and then to try and pair the individual studies together to arrive at the Spread direction from a different angle. Also, we can study the correlation between the exchange rates and the Spreads at other points in the yield curve, for instance the correlation between the 2Yr Bund-Bond Spread and the Euro-Dollar. These could give us additional insight into the direction of the Yield Spreads and hence into the direction of the currencies as well.
CONCLUSION
Of course, while the correlation between Yield Spreads and currencies is highly reliable most of the times, there are times when, like everything else, it does not work very well. This is to be expected and allowed for. Further, while it is one of the most important factors to watch, it is not the only one. That again is to be understood in the corrective perspective. All said, however, if there is one single factor that should definitely be tracked to figure out currency movements, it is the Yield Spread between countries.
PS:
You can track our ongoing daily forecasts on Yield Spreads and Currencies in our free Morning Briefing report.

You may also like:

In our last report (27-Feb-26, UST10Yr 4.01%), which was published just one day before the start of the US-Israel-Iran War on 28-Feb, we had continued to target 4.60% on the US10Yr based on expectations of higher Crude. At that time, we were looking for Brent to rise …. Read More

The escalation of war between US and Iran throughout March-26 has led to a rally in Brent prices to as high as $119.50, exceeding our bullish targets by a large margin, much ahead of expected time. Will it remain bullish for the coming years?… Read More

Our view of a fall towards 1.14 seems to be playing out well so far as the tensions in the Middle East and the US-Iran conflict have triggered a rise in Dollar Index and crude oil prices, thereby weakening to Euro to 1.1507 so far in Mar-26. Will it again attempt to rise targeting 1.20? Or will it remain below 1.19/20 now and see an eventual decline to 1.10? …. Read More
In our 09-Mar-26 report (10Yr GOI 6.69%) we had warned that the sharp rise in crude due to the US-Iran conflict could push Brent toward $134, which would lift CPI toward ~6.2%, eliminating any chance of RBI easing, and potentially force tightening. This inflation shock, along with higher US yields, was expected to push the 10Yr GOI up to … Read More

In our 10-Dec-25 report (USDJPY 156.70), we expected the USDJPY to trade within 154-158 region till Jan’26 before eventually rising in the long run. In line with our view, the pair limited the downside to … Read More

Our March ’26 Dollar Rupee Monthly Forecast is now available. To order a PAID copy, please click here and take a trial of our service.