

Study on Crude - Jan'18
Jan, 20, 2018 By Saandhy Ganeriwala 0 comments

20-Jan-18: Brent 68.61
EXECUTIVE SUMMARY
Crude Oil looks set for a phase of correction after the recent rally, post which there will be medium term bullishness. Our prediction for a corrective phase is supported by short-term technical charts where resistances for both Brent and WTI have been tested recently, and also by WTI derivatives’ positioning reflecting overbought conditions. However, with global demand-supply balance likely to rise to 1.5-2.0 million barrels per day (from 0.92 million barrels per day in Oct-Dec’17), we can expect Brent to touch 77 by Dec’18.
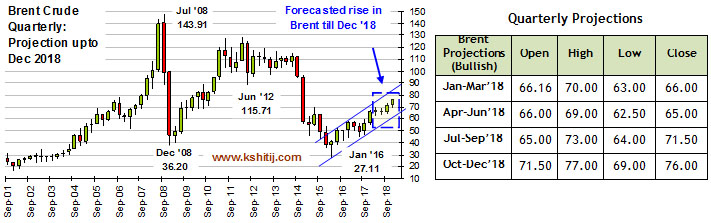
Quarterly Projections
DIP TOWARDS 66-63
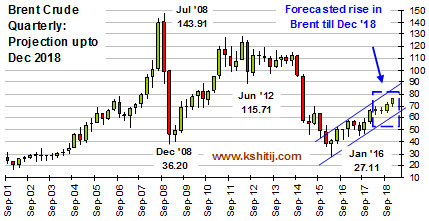
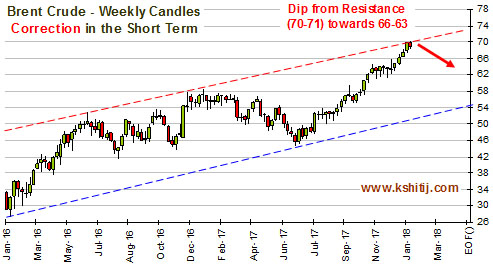 Brent has already started dipping, supported by a rise in US weekly crude production. We project this correction to continue, with the range being restricted to 62.5-69.0 till June’18. Post that, Brent could resume its upmove, seeing highs near 73 in the July-Sep’18 quarter and continuing the momentum in the Oct-Dec’18 quarter to touch 77. There is long term resistance on the quarterly candles near 80, which shouldn’t be tested/breached. The likelihood of surging US production (led by Shale) balancing OPEC cuts keeps the upside restricted below 80.
BACKWARDATION SETTING IN
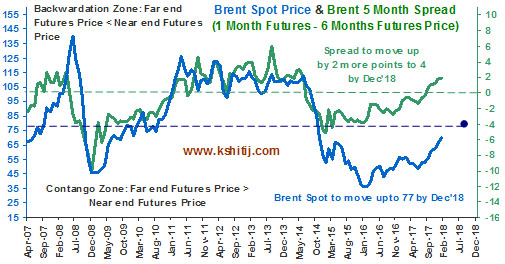 Backwardation has set in for both Brent & WTI (detailed illustration of the phenomenon in Page 3). Since Sep’17, the spread between 1 month Futures & 6 month Futures for Brent has turned positive, reflecting undersupply in the market. As seen in the adjacent graph, this spread is highly correlated with Brent spot. In the past, all crashes and rallies have been preceded by this spread changing trend towards the –ve (crashes) or +ve (rallies). The spread could move up to 4 by the year end, taking Brent to 77.
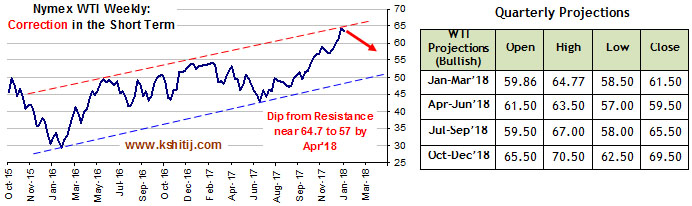
DIP TOWARDS 60-57
Like Brent, WTI tested resistance on weekly line charts by reaching a high of 64.88 on 15th Jan’18 but has been dipping thereafter. We see the dip extending till next quarter and a resumption of bullishness in the Jul-Sep’18 qtr (projected highs of 67). The year could end with WTI touching 70-70.5 as Brent tests 77.
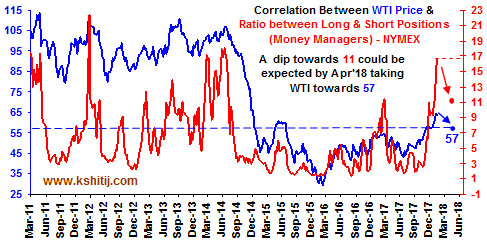 OVERBOUGHT DERIVATIVES
Historically, positive correlation has been seen between sentiments of money managers in the trade of WTI derivatives, and the actual WTI price. We use the ratio between long and short positions as a proxy to indicate the prevailing sentiments among hedge funds regarding WTI prices. Levels prevailing currently (16.7) haven’t been seen in the last 3 and half years, compelling us to be wary of a dip in sentiments, and hence a dip in the ratio. We expect a drop to 11 by next quarter, taking WTI to lows near 57 in the Apr-Jun’18 quarter.
DEMAND-SUPPLY BALANCE TO RISE FURTHER
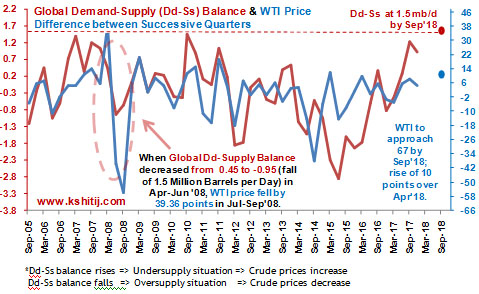 A positive directional correlation is seen between Demand-Supply balance and WTI price change in the next quarter. With OPEC countries broadly adhering to the 1.2 mb/day (million barrels per day) supply cut and global demand slated to increase by 1.53 mb/day (OPEC’s forecast), even a dramatic rise in US shale production (say, by 1 mb/day) is unlikely to shift the balance in the negative or near 0 any time soon. By Sep’18, we see this balance at 1.5 mb/day (from 0.92 mb/day in Oct-Dec’17), thereby taking WTI towards 67.
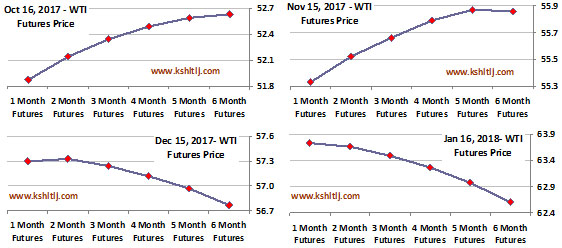
BACKWARDATION SETTING IN FOR BRENT & WTI
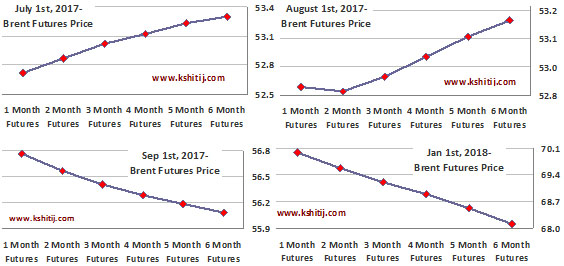
We see here a depiction of backwardation in Brent & WTI futures. The 1 month – 6 month futures spread for both have turned from negative to positive (from Sep’17 for Brent and from Dec’17 for WTI). This might indicate the beginning of a long term bullish phase for crude oil in 2018.
THINGS TO LOOK OUT FOR
- Increases in US Shale Production and adherence by OPEC + Russia to supply cuts
- Ratio of Money Managers’ Long to Short Positions in WTI Futures on NYMEX
- Spread between Price of 1 month Futures and 6 month Futures for Brent and WTI
CONCLUSION
2018 is expected to be bullish on the whole for Crude Oil. The recent rally will be followed by a phase of short term corrections for both Brent (66-63 by Mar’18) and WTI (57 by Apr’18), post which, surging global demand would take both to highs near 77 (Brent) and 70.5 (WTI) by Dec’18.

Saandhy Ganeriwala
Saandhy is a postgraduate in Economics, but like all good market-men, he seeks confirmation from technical analysis charts for his macroeconomic ideas. His research is a good mix of charts, stats and econ. Apart from that, he calls himself a news junkie and an occasional writer.
You may also like:


In our last report (27-Feb-26, UST10Yr 4.01%), which was published just one day before the start of the US-Israel-Iran War on 28-Feb, we had continued to target 4.60% on the US10Yr based on expectations of higher Crude. At that time, we were looking for Brent to rise …. Read More

The escalation of war between US and Iran throughout March-26 has led to a rally in Brent prices to as high as $119.50, exceeding our bullish targets by a large margin, much ahead of expected time. Will it remain bullish for the coming years?… Read More

Our view of a fall towards 1.14 seems to be playing out well so far as the tensions in the Middle East and the US-Iran conflict have triggered a rise in Dollar Index and crude oil prices, thereby weakening to Euro to 1.1507 so far in Mar-26. Will it again attempt to rise targeting 1.20? Or will it remain below 1.19/20 now and see an eventual decline to 1.10? …. Read More
In our 09-Mar-26 report (10Yr GOI 6.69%) we had warned that the sharp rise in crude due to the US-Iran conflict could push Brent toward $134, which would lift CPI toward ~6.2%, eliminating any chance of RBI easing, and potentially force tightening. This inflation shock, along with higher US yields, was expected to push the 10Yr GOI up to … Read More

In our 10-Dec-25 report (USDJPY 156.70), we expected the USDJPY to trade within 154-158 region till Jan’26 before eventually rising in the long run. In line with our view, the pair limited the downside to … Read More

Our March ’26 Dollar Rupee Monthly Forecast is now available. To order a PAID copy, please click here and take a trial of our service.