

Euro Long term Forecast - Jan'18
Jan, 24, 2018 By Vikram Murarka 0 comments

24-Jan-18: Euro 1.2342
RECAP
In our Sep’17 report we had retained the upside target of 1.2250, with a possibility of an interim dip towards 1.17/16. The market played out exactly as expected. A dip to 1.1574-1.1554 was indeed seen in Oct-Nov’17 and has been followed by a rise to 1.2323 in Jan’18 so far. We were also looking for a rise in the German 10Yr Yield towards 0.45% and a rise in EURINR to 77, both of which have also moved exactly as expected in the last 4-months.
EXECUTIVE SUMMARY
Our preferred short term view is for resistance on the Euro near 1.2350 to hold in the near term (Jan) producing a correction towards 1.20-1.19 (Feb), before targeting 1.25 by March-April. Thereafter, we may either see a corrective fall towards 1.17-16 (less preferred) or a straight rise past 1.25, which is the more preferred possibility, taking into consideration some historic structural similarities in the Euro monthly candlestick chart.
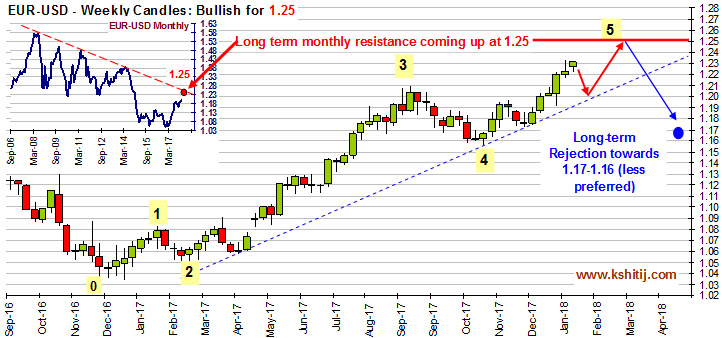
RISE TOWARDS 1.25 IN THE SHORT TERM
The weekly chart above shows the rise from 1.035 at the beginning of 2017 up to 1.2356 now, which we have analyzed as a possible 5-wave formation. We are currently in the 5th wave of the large 5-wave upmove (starting Jan ’17) and given this wave count, we assume an immediate downleg towards 1.20 from 1.23 currently, before a rise towards long term resistance near 1.25 (resistance shown in monthly line chart above), which would complete our 5-wave projection in the next 2-3 months.
Thereafter, our less preferred long term view stems from a possible A-B-C correction towards 1.17-1.16, which would happen if resistance at 1.25 turns out to be strong enough to produce a sharp rejection.
CHANCES OF BREAK PAST 1.25?
In the next page, we explain the structural similarities in price movement between two periods, the first in 2002-03 and the second being now, terming it ‘fractals’. Given that the fractals have been working very well so far, we give greater preference to the current period working out similar to the 2002-03 period. Going by this analysis, we tilt towards a straight rise past 1.25 after the initial 2-3 months, rather than a corrective fall towards 1.17-16 as shown above.
Of course, it would be important to watch price action near 1.25 around Mar-Apr’18 to decide whether the Euro will actually move up past 1.25, replicating the movement as seen in Apr ’03, or come off from the resistance.
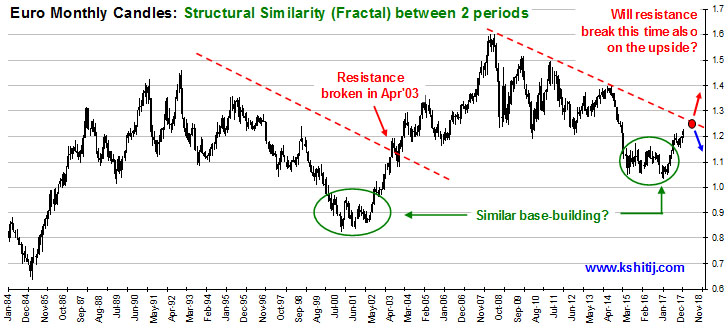
The above chart shows the structural similarity of price movements between the 2002-03 period and now in 2017-18. The current price scenario indicates a rise towards 1.25, in line with our projection for the next 2-3 months as mentioned in the previous page. But thereafter, a fall towards 1.17-1.16 is a matter of doubt since a similar situation in Mar-Apr 2003 saw the price move up sharply, breaking above the then long term resistance near 1.10 coming down from 1992, as marked in the chart above. Thus, if the historical fractal continues to play out, we could well get a straight rise past 1.25 in April 2018.
EUR/USD (LHS) and GERMAN-US 10Yr YIELD SPREADS (RHS): Euro can rise even if Spread falls
 |
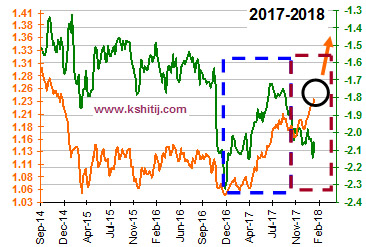 |
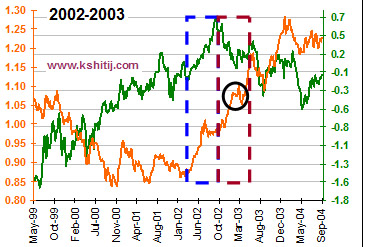
*Blue Dotted Box: Positive correlation in 2002 on the left chart above and similar behavior seen in Nov’16-Sep’17 period on the right hand chart above.
*Brown Dotted Box: Divergence in correlation in 2003 on the left chart and the similar behavior currently underway on the right hand chart.
*Black Circle: Shows a 9-week (mid-Feb’03 to mid-Apr’03, 1.10-1.05) sideways movement on the left chart. Similar 9-week sideways movement within 1.25-1.20 in the Feb-April’18 period is expected as shown on the right hand side chart.
The above charts show similarity between how the Euro and the German-US spread behaved in 2002-2003 (left hand chart) and how they are behaving currently (right hand chart). This similarity yields 2 important forecasts:
- Euro likely to rise even while the German-US Yield Spread falls: The 2002 Euro uptrend from 0.85 to 1.00 (Mar’02-Oct’02) had seen positive directional correlation with the German US spread. Similarly, the Jan ’17 to Dec’17 Euro uptrend (from 1.04 to 1.175) saw positive correlation with the spread. This correlation had weakened post Oct ’02 (during the rise in Euro from 1.00-1.20). Similar divergence in correlation has been seen this time as well (since the Euro rose from 1.175 to current levels). The divergence in correlation is likely to continue going forward, given our bullish projection on the US yields (study available on request). Thus, the Euro can strengthen past 1.25 without yield support.
- 9 week consolidation ahead: In 2003, there was a 9-week consolidation (mid-Feb’03 to mid-Apr’03) after the rise towards 1.10 (shown by black circle on the left chart). A similar sideways movement is being projected in the right hand side chart for the next 9-weeks (Feb-Apr’18) before a sharp rise happens towards 1.30-1.35 levels.
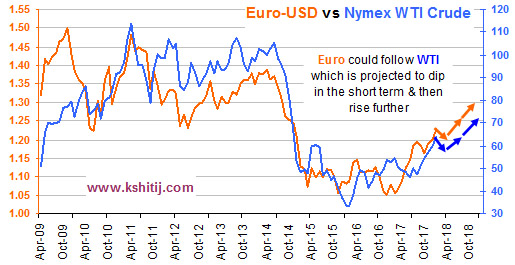 STRONG WTI, STRONG EURO?
This chart shows close positive correlation between Nymex WTI and EUR-USD.
We are projecting a fall in WTI towards 60-57 by Apr-May’18 before a sharp rise towards 63-65 by Sep-Oct’18 and further towards 70-72 by Dec’18. Correspondingly, we could see some stability in Euro for a couple of months, before it rises sharply to 1.25 and higher, maintaining its close correlation with WTI. This also is in line with the bulllish Euro view from the fractal study.
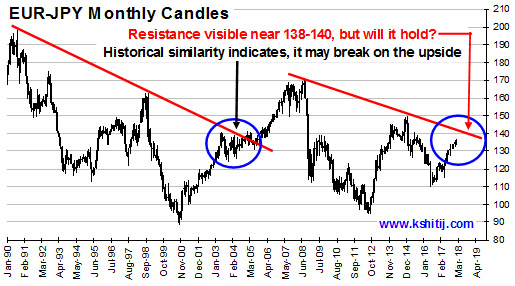 RESISTANCE ON EUR-JPY MAY BREAK?
Looking at similar fractal periods in EUR-JPY, we find that a break of resistance happened in 2003; thereby raising questions on whether the current upcoming resistance near 138-140 will hold.
If history repeats itself, the Euro-Yen may move sideways in the 140-130 region (or within 145 & 125) for a few months before rising past 140 in the longer run, which will be supportive of a rise past 1.25 on the Euro-Dollar.
CONCLUSION
 We expect Euro historical fractal to be repeated. After some correction towards 1.20 in the coming weeks, the Euro could breach resistance at 1.25 to aim for 1.30-1.40 later in the year.

You may also like:


In our last report (27-Feb-26, UST10Yr 4.01%), which was published just one day before the start of the US-Israel-Iran War on 28-Feb, we had continued to target 4.60% on the US10Yr based on expectations of higher Crude. At that time, we were looking for Brent to rise …. Read More

The escalation of war between US and Iran throughout March-26 has led to a rally in Brent prices to as high as $119.50, exceeding our bullish targets by a large margin, much ahead of expected time. Will it remain bullish for the coming years?… Read More

Our view of a fall towards 1.14 seems to be playing out well so far as the tensions in the Middle East and the US-Iran conflict have triggered a rise in Dollar Index and crude oil prices, thereby weakening to Euro to 1.1507 so far in Mar-26. Will it again attempt to rise targeting 1.20? Or will it remain below 1.19/20 now and see an eventual decline to 1.10? …. Read More
In our 09-Mar-26 report (10Yr GOI 6.69%) we had warned that the sharp rise in crude due to the US-Iran conflict could push Brent toward $134, which would lift CPI toward ~6.2%, eliminating any chance of RBI easing, and potentially force tightening. This inflation shock, along with higher US yields, was expected to push the 10Yr GOI up to … Read More

In our 10-Dec-25 report (USDJPY 156.70), we expected the USDJPY to trade within 154-158 region till Jan’26 before eventually rising in the long run. In line with our view, the pair limited the downside to … Read More

Our March ’26 Dollar Rupee Monthly Forecast is now available. To order a PAID copy, please click here and take a trial of our service.