

Euro Long term Forecast - Aug'17
Aug, 05, 2017 By C S Vijayalakshmi 0 comments

5-August-17 / Euro 1.1772
RECAP:
In our July’17 report, our bias was stated as neutral as Euro was standing at an inflection point. The success or failure to rise above the major resistance of 1.1450-1.1500 was to determine the near to medium term path.EXECUTIVE SUMMARY
The rising German-US yield spread brought back the possibility of a long term bullish reversal back on the table last month and now with a break above 1.1500, the first signal for that reversal has been established. Our latest studies indicate Euro may rise to 1.2050 this quarter and to 1.2250 in the following 6 months. The chart above showing the amazing similarity in the price structure between the periods of 1985-2002 and 2002-2016 was discussed last month. With a break above the May’16 top of 1.1620, the similarity is sustained and confirms the initial signal for a fresh bull market. The current rise has established the first higher high. If the next correction ends at a higher low (say near 1.11 at most), compared to the 2017 low of 1.0339 and thereafter a fresh high is made, the bull market will be fully confirmed. At this point, the chances of a higher low near 1.1100 looks good.
EURO: POSSIBLE PATH
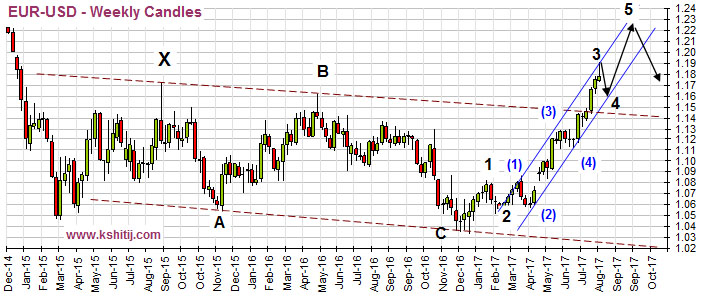 The chart above shows the Elliott Wave labeling and the probable path for Euro in the coming 3-4 months. According to this path, we may see a minor pause for 3-4 weeks after a high near 1.1900 and thereafter a new high around 1.2050 is expected, which may be followed by a lengthy correction for a 2-3 months.
EURO vs 2Yr GERMAN BUND/T-BOND DIFF: DIVERGENCE
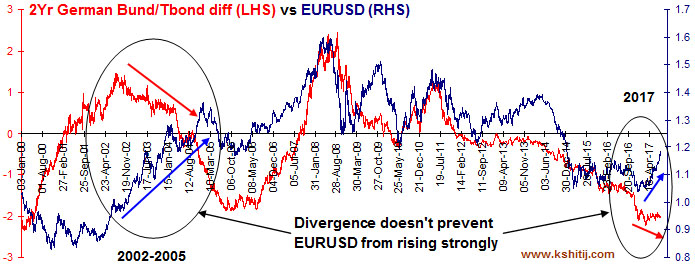 This chart shows the 2Yr German Bund/US T-Bond yield spread against Euro since 2000. While both of them move in sync most of the times, 2017 is seeing a divergence (which is not visible for 10Yr 2Yr German Bund/T-bond yield spread against Euro). While this divergence is not the usual case, a very similar divergence was seen in the period of 2002-05, as shown in the first circle on the chart. In 2002-2005, the 2Yr yields spread kept going down but that didn’t stop Euro rallying and making new highs. If the phenomenon is repeated now, Euro can keep rising despite the divergence.
QUARTERLY PROJECTIONS
 The previous projection is revised upward with the much sooner than expected rally to 1.18 levels. The current rally may take Euro 1.2050 levels before a medium term correction/consolidation but the downside for the next two quarters is expected to be limited to 1.15. The correction may be followed by another surge and test the major resistance of 1.2250 which may hold.
EURO-RUPEE: UPSIDE LIMITED TO 78.00 FOR NOW
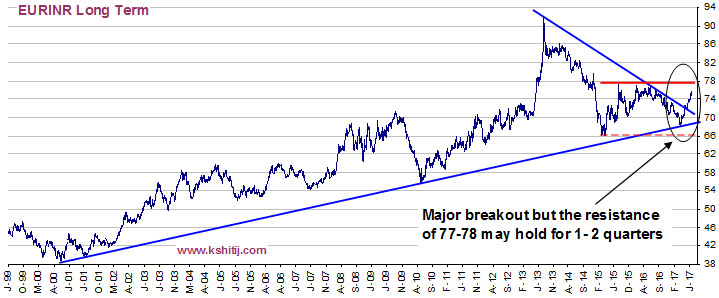 With EURUSD rising strongly, EURINR (75.70) has not only made only a gain of almost 11% from the 2017 low of 68.24 but also has also broken above the long term downtrend line coming down from 92 in 2013. Yet, EURINR may not appreciate commensurately with EURUSD as Rupee remains strong.
Weakness in USDINR is our preferred view, which limits the Euro’s gains vis-a-vis Rupee. If EURUSD rallies to 1.2050 and USDINR trades at 63.50, then we may expect EURINR at 76.52, compared to the current level of 75.70. Even with EURUSD at 1.2250 and assuming Rupee at the same 63.50 levels, we get 77.79 for EURINR, which implies very low chances of EURINR rising above the resistance of 78.00 in the coming few months.
With EURUSD rising strongly, EURINR (75.70) has not only made only a gain of almost 11% from the 2017 low of 68.24 but also has also broken above the long term downtrend line coming down from 92 in 2013. Yet, EURINR may not appreciate commensurately with EURUSD as Rupee remains strong.
Weakness in USDINR is our preferred view, which limits the Euro’s gains vis-a-vis Rupee. If EURUSD rallies to 1.2050 and USDINR trades at 63.50, then we may expect EURINR at 76.52, compared to the current level of 75.70. Even with EURUSD at 1.2250 and assuming Rupee at the same 63.50 levels, we get 77.79 for EURINR, which implies very low chances of EURINR rising above the resistance of 78.00 in the coming few months.
CONCLUSION
Euro has provided initial signal for a long term reversal, which has opened up targets of 1.20 as discussed in the previous report. The target of 1.2050 may be achieved in the current quarter itself and 1.2250 by the Mar’18 quarter with the downside limited to 1.1600 levels for 2017.
C S Vijayalakshmi
Vijayalakshmi has the rare ability to look at charts using both Classical charting as well as Elliot Waves, which she combines with excellent proficiency in Excel. A growing presence in the social media sphere, she is also an accomplished danseuse and choreographer.
You may also like:

In our last report (29-Apr-26, UST10Yr 4.35%), we had said that the FED was likely to leave rates unchanged, which it did. We had also said that “once Kevin Warsh comes in, the FED is more likely to cut, responding to …. Read More
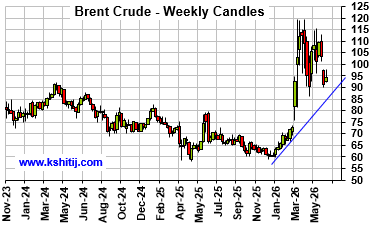
In our May 2026 report (4-May-26, Brent @ $110.75), we expected Brent to test $90.50 by Jul-26, followed by a rise to $145.13 by Sep-26 and $161.93 by Dec-26. Sustained trade below $100 was expected to be seen only on a credible resolution of the US-Iran war, which looked unlikely … Read More
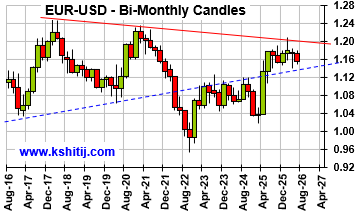
In our May 2026 report (11-May-26, EURUSD 1.1762), we expected the Euro to rise to 1.1950 by May-26 before falling towards 1.16-1.14 in the coming months. We delayed the fall to 1.10 from the earlier expected Aug-26 to Mar-27 as the Dollar Index remained within a broad range for more than expected …. Read More

In our 11-Apr-26 report (10Yr GOI 7.03%) we had retained our bullish view on Brent towards $134 by Sep-26, while allowing for a near term dip to $95 on hopes of a US-Iran resolution. Brent fell to $89.93, lower than … Read More

In our 10-Dec-25 report (USDJPY 156.70), we expected the USDJPY to trade within 154-158 region till Jan’26 before eventually rising in the long run. In line with our view, the pair limited the downside to … Read More

Our June ’26 Dollar Rupee Monthly Forecast is now available. To order a PAID copy, please click here and take a trial of our service.