

Developments in the Indian Rupee Market
Jan, 22, 2009 By Vikram Murarka 0 comments


"Where is the market going?” is the foremost thought that occupies most market participants most of the time. In general the reference is to Price - whether it is going up, down or sideways. The more literal reference of this common question would be to the changes and developments taking place in the marketplace itself. This issue of The Colour of Money takes note of some of the significant developments in the Dollar-Rupee market that have taken place recently.
Importance of the Dollar-Rupee Market
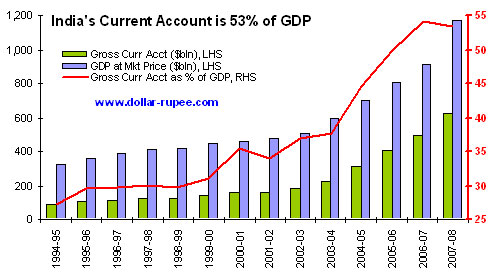 India is now a “trillion dollar economy”, having picked up steam since 2002. It is to the credit of the country’s reforms programme that the openness of the economy, measured by the Current Account to GDP Ratio, has kept pace with, perhaps outpaced, the growth in the economy. The gross total of India's exports, imports, software exports and personal remittances etc. was equal to 27% of GDP in 1994-95. This ratio has moved up significantly, to 53% in 2007-08. The foreign exchange market is supposed to be an arcane world, which few people know about and fewer can fathom. But, it’s time everybody started figuring out how the FX market works, because exchange rate movements now impact at least 53% of the economy!
Another reason why people ought to know more about the FX market is that it is now as big as the Stock market. Volumes in the USD-INR Spot market stood at $16.5 bln in September-08, rivaling the volumes (cash + F&O) in the Stock market. On the one hand, volumes in the FX market have risen due to the increasing openness of Indian economy, as cited above. On the other hand, the crash in the Equity market over the last twelve months has led to a sharp contraction in volumes. Daily stock market volumes had fallen by almost half, to $16.4 bln by Sep-08, from the daily average volume of $28.6 bln in Oct-07.
 Rising volatility
Hand in hand with the rising volumes, volatility in the Dollar-Rupee market has also seen a huge surge in the second half of 2008. We measure volatility as the Daily Amplitude, which is the difference between the High and the Low for the day. This measure has moved up from up from a range of 5-20 paise a day in the five years from 2003 to 2008, to as much as 45 paise a day, by Sep-08. In fact, the Daily Amplitude is a muted measure of volatility because it does not take into account Opening Gaps (difference between the Open on any day and the Close of the previous day). If we factor in Opening Gaps, the volatility will be even larger.
The linkage between the increase in volumes and increase in volatility is that the RBI’s ability to dampen volatility has been severely constrained by the rise in volumes. The RBI has to increase the size of its market interventions now in order to make a dent in the prices. And that is something it cannot always afford to do these days.
 Three markets for the same commodity
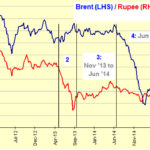
The Dollar-Rupee is now traded in three distinct markets. Prices in each market differ from those in the others, as can be seen from the chart alongside. The Blue band represents the daily high-low for the 1-month maturity in the offshore NDF (Non-Deliverable Forwards) market. The Green band represents the highs and lows in the onshore exchange traded Dollar-Rupee Futures market. Finally, the Brown band shows the highs-lows in the onshore OTC market. Prices differ between markets because participants in one market cannot easily transact in another market, due to regulatory or logistical constraints. Naturally, there is an arbitrage opportunity for the few who can straddle two (or three) markets at the same time.
Note that “delivery” or actual exchange between US Dollars and Indian Rupee is permitted only in the onshore OTC market (which incidentally trades Cash, Spot, Forwards, Options and Swaps). The NDF and Futures markets (which trade Forwards/ Futures only) are “non-deliverable”. The offshore NDF market exists because it permits FIIs to “dynamically hedge” (or trade/ speculate), something they are not allowed to do in the onshore OTC market. Unification of the three markets can be achieved by dismantling regulatory constraints. This would lead to better price discovery for Dollar-Rupee, but perhaps at the cost of greater volatility. Whether that is a worthwhile deal or not, is for the RBI to decide.

You may also like:

In our last report (27-Feb-26, UST10Yr 4.01%), which was published just one day before the start of the US-Israel-Iran War on 28-Feb, we had continued to target 4.60% on the US10Yr based on expectations of higher Crude. At that time, we were looking for Brent to rise …. Read More

The escalation of war between US and Iran throughout March-26 has led to a rally in Brent prices to as high as $119.50, exceeding our bullish targets by a large margin, much ahead of expected time. Will it remain bullish for the coming years?… Read More

Our view of a fall towards 1.14 seems to be playing out well so far as the tensions in the Middle East and the US-Iran conflict have triggered a rise in Dollar Index and crude oil prices, thereby weakening to Euro to 1.1507 so far in Mar-26. Will it again attempt to rise targeting 1.20? Or will it remain below 1.19/20 now and see an eventual decline to 1.10? …. Read More
In our 09-Mar-26 report (10Yr GOI 6.69%) we had warned that the sharp rise in crude due to the US-Iran conflict could push Brent toward $134, which would lift CPI toward ~6.2%, eliminating any chance of RBI easing, and potentially force tightening. This inflation shock, along with higher US yields, was expected to push the 10Yr GOI up to … Read More

In our 10-Dec-25 report (USDJPY 156.70), we expected the USDJPY to trade within 154-158 region till Jan’26 before eventually rising in the long run. In line with our view, the pair limited the downside to … Read More

Our March ’26 Dollar Rupee Monthly Forecast is now available. To order a PAID copy, please click here and take a trial of our service.