Author Archives: Ranajay Banerjee

About Ranajay Banerjee

Leads the research team at KSHITIJ,COM. Has a deep understanding of Elliot Waves and a formidable memory of market history. Well known on Twitter as @ranajayb with a considerable fan following. Film scriptwriter by night.

Global Equities

Global Equities: Time for a breather?

Dow 20453 / World 1843/ BRIC 270 / Nifty 9150 / Russell 2k 1345

Global Equities

The global equities are seeing a booming bull market, ignoring all the anxiety, worries and distrust among pundits. As the market adage goes, “a bull market climbs the wall of worries”. The current bull markets in the US and India are doing just that.

Within this context, the major uptrend may consolidate for a few months before climbing to greater heights. In this report we examine the outlook for the US markets, the World Index, the BRIC Index and Indian equities.


EXECUTIVE SUMMARY:

The  global equity markets are in a strong uptrend and the rise may continue in the long term, but in the near term, the markets may take a long overdue rest as the overextended price needs to come down a bit before the rally can extend to the higher levels. We check both Dow Jones and Russell 2000 for the US market, the World Index, MSCI BRIC and Nifty, all of which point towards a rest period in the next few months.

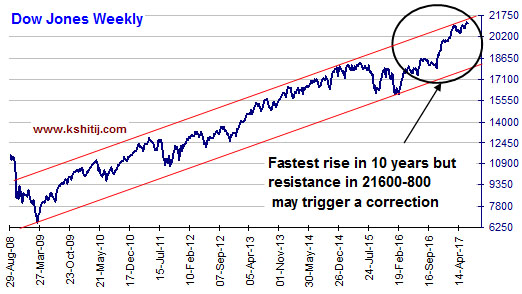
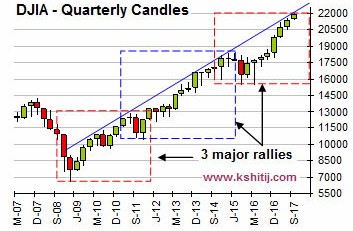
Dow Jones: Higher chances of rally continuation

Dowjones Weekly

As seen above, the Dow has dipped from a channel resistance. As per Elliot Waves, the (3)rd of the 3rd might have gotten over at 21169 in early March, near the trendline and if so, a corrective dip towards 20450-20050 may be seen before the 5th of 3rd may start. Alternatively, the 3rd of 3rd may still continue till 21800 or even 22000-400 before any significant correction emerges. But as long as the resistance at 21100 holds, a dip towards 20450-20050 may be more likely. The greater chance of a correction is suggested by the broader small cap universe, the Russell 2000 Index below.


Russell 2000 – Broader market index

Russell 2000 Quarterly

The Russell 2000 is a good indicator of the broader market strength of US equities, and it closely follows Dow Jones. As the log chart above clearly shows, the index is facing rejection at a 17-year old channel resistance and may find it difficult to break above 1420 immediately. As long as Russell 2000 stays contained, Dow may struggle to rise too.


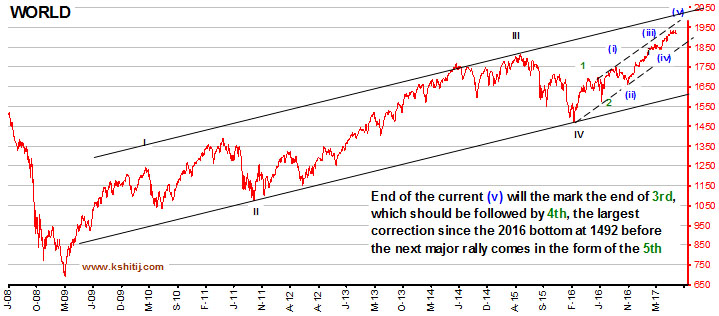
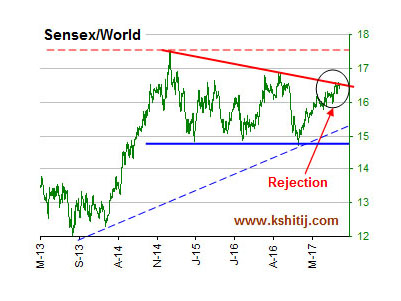
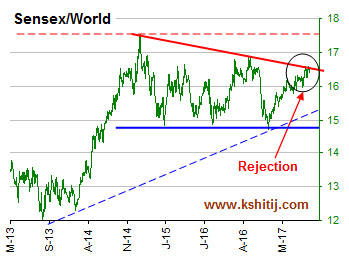
World, Long Term: Strongly bullish but testing resistance

World Index

The chart above shows the MSCI World Index testing the long term resistance near 1850 which may not give way in the very first attempt and may produce a dip to 1750. That said, the overall uptrend remains intact while above 1750.
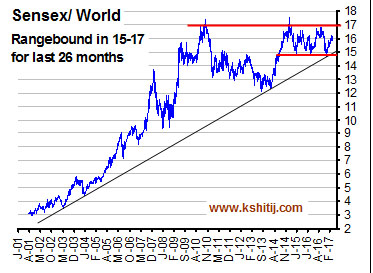
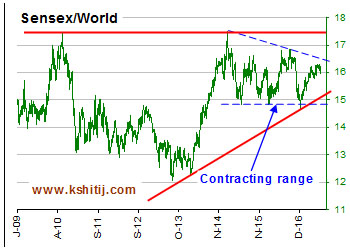
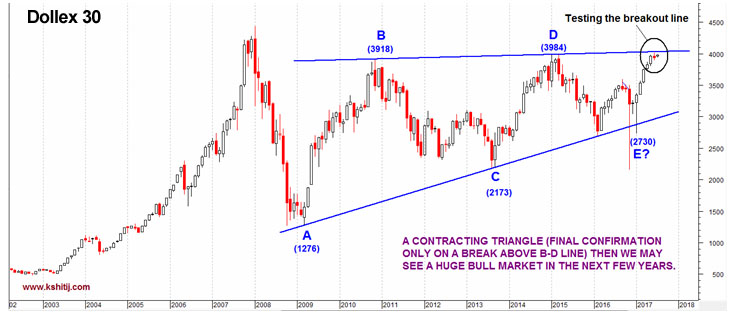
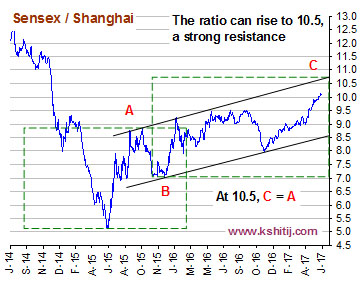
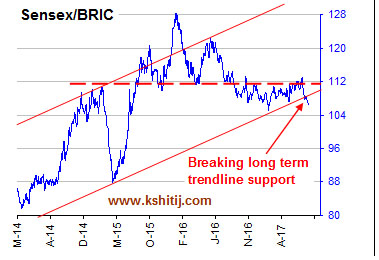
 

MSCI BRIC Index:

MSCI Bric and Sensex Bric

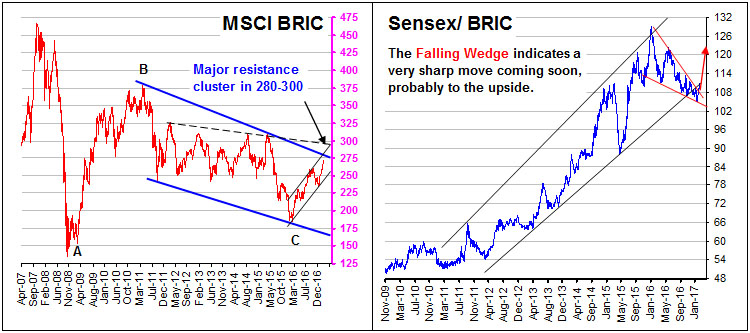
A similar kind of resistance is seen on the MSCI BRIC Index also, as evident from the left side chart above. The index may struggle near the resistance at 280-300 for a while before breaking above 300 successfully. In the meanwhile, Sensex may outperform the BRIC as signaled by the Sensex/BRIC chart on the right hand side. The falling Wedge formation indicates severe lack of downside momentum and a strong possibility of a breakout to the upside targeting 325-50. That said, while the Sensex may be in a huge bull market, it may also first take a pause for a few months.


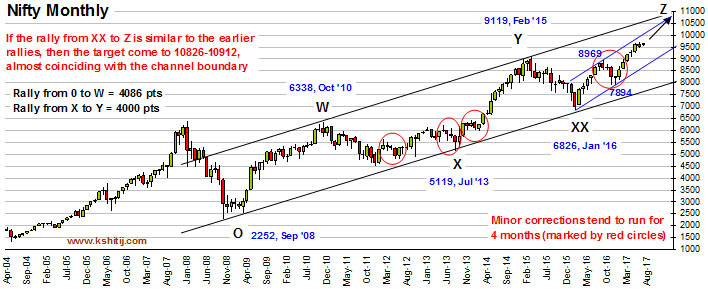
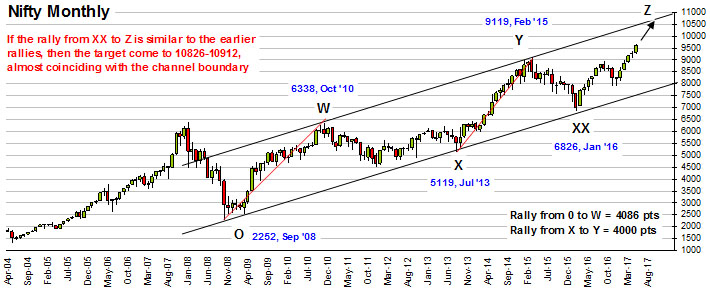
Nifty long term: Shallow correction likely before huge rally

Nifty Weekly

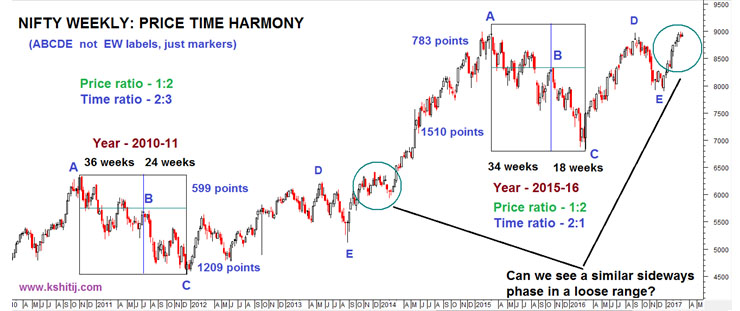
The chart above essentially shows the similarity of the two corrective phases seen in 2010-11 and 2015-16. If the two major corrective phases are similar, then the following price action may be expected to unfold”

In the first corrective phase in 2010-11, the correction from 6339 (A) to 4531 (C) was clearly divided into two clear parts (marked by blue AB and BC). Price wise, AB was 599 points against 1209 points of BC, a nice ratio of 1:2. Time taken by AB was 36 weeks against 24 weeks taken by BC, again a perfect ratio of 3:2. Both the time and price implied strong geometry at work which confirmed the bottom and unleashed the next bull market.

In the second corrective phase (2015-16), a similar market geometry was at work. Again, the entire decline from 9119 (A) to 6825 (C) was divided into 2 clear parts with the price ratio approaching 1:2 and the time ratio matching the price ratio here was 2:1.

This kind of price-time harmony generally indicates very significant top or bottom and in the first case, Nifty had doubled from the low of 4531 in the year 2011 to 9119 by year 2015. In the current and second instance, an appreciation of more than 30% has already been seen from the 2016 low of 6825 to the high of 8969 in the same year.

In the first instance, the initial rally from 4531 topped out at 6229 (D), about 1.6% lower from the previous high of 6339 (A). Similar rally and top was seen in 2016 too, as the rally from 6825 topped out at 8969 (marked by D), again 1.6% lower from the previous high of 9119 (A). In both the cases, corrections of 1100 points took place (marked by E).

If the list of these similarities continues in the same way, then we may expect the current bounce from 7894 (E) to fade in a long sideways phase in a loose range for 2-3 months, helping the currently overstretched Nifty to come down for a while before the next huge rally emerges.


Conclusion:

The Dow may have already started a corrective phase from the resistance of 21169 and may trace a long overdue sideways phase in the range of 20300-21500 (+/- 300). That would match nicely with the Nifty, which may also be entering a sideways phase between 8800-9300 (+/-200) for the next few months. This stable period could be followed by a year-end rally towards 22500 for Dow and 9900-10000 for Nifty.

Dow & cboe vix

Global Equities: Powering to the upside

Shanghai 3113/ Dow 20982/ World 1902/ CBOE VIX 10.45/ Sensex 30550

RECAP:

In the Apr’17 report, we expected the markets to take long overdue rest and correct a bit before continuation of the present bull market. Both Dow and Nifty were expected to trade within ranges of 20300-21500 (+/-300) and 8800-9300 (+/-200) respectively and see corrective dips within the stated ranges. However, instead of dipping, both indices have moved up within their stated ranges.


EXECUTIVE SUMMARY:

While China is weakening visibly, the other major markets are very comfortable at the higher levels and this most unloved bull market may continue climbing the wall of worries. We look for 2980 on Shanghai, 21200-300 on Dow Jones in May. In case of Nifty, we would prefer to watch the price action near the make or break level of 9500.


Shanghai: Waiting for bearish confirmation

Shanghai Daily

Among the global Equity Indices, the Shanghai is the most worrisome at the moment. The chart above marks the number of days taken in each major movement since the beginning of 2016. There is a strong time-similarity between the rallies and declines, pointing to 7-legged Diametric as the most probable pattern formation. This gives us a clear tool to gauge if the entire rise from the 2016 low of 2638 is over at the 2017 high of 3295 or more sideways consolidation in 3000-3300 is to be expected.


A break below 2978 in less than 43 sessions, the duration of the decline from 3097 (A) to 2780 (B), the first and largest decline inside the pattern, (i.e. by 19th May’17) will confirm the end of the rise from the 2016 low of 2638 to the 2017 high of 3295. If that happens, then the 3295 can be taken as a major top and further decline towards 2600 or even lower can be expected in the coming months.


In case, the decline remains smaller and slower, then the probability of further sideways consolidation in the range of 3000-3300 (+/- 50) will increase significantly.


We check the global markets in the next pages, particularly the US market and the Indian markets along with the World Index.


World Index 

World Index

While the Shanghai Index looks potentially bearish, the World market remains indifferent to the turmoil in the Chinese markets and continues to rally. The most conservative Elliott Wave count above points towards a target of 2005 (a gain of 6.6% from the current levels) before any significant correction. However, we have to be careful about channel resistance near 1960-70 (4.5% gain).


Volatility at 25-year low but not a danger signal yet

Dow & cboe vixFear about a sudden crack in Dow has been spreading globally as the historically low levels in VIX is seen taken as a sign of complacency, which could be a precursor to a fall. But as the chart above shows, not all collapse in volatility gives birth to major corrections and if and when a major correction actually comes, it generally takes place after another 11-12 months. VIX has just hit the 25-year lows in the area of 10.00-9.00, implying more upside may be left in the coming months before any major top formation. We may look for signs of possible topping out in Dow near 21700-800 but not before that.


Sensex remains strong

Sensex / World BSE Sensex and Momentum

The left chart that the Sensex/World ratio is very stable in the range of 15-17 with little chance of breakout, which means no significant outperformance or underperformance is expected in the near term. On the other hand, as seen in the chart on the right hand side, both Sensex and the underlying momentum (green line) are seeing major breakouts above their earlier resistances, signaling continued rally with no visible fatigue yet. Sensex may rise to 32000-300 in the next 2 months, similar level for Nifty being 10000.


Conclusion:

We will be watching if Shanghai breaks 2978 within 19th May’17 and confirms a resumption of the major bear market but Dow can rise to 21700-800 and 22500 after the current consolidation. The comparative outperformance of the Indian markets against World may push Nifty to 10000 (Sensex 32000-300) in the next couple of months on a firm break above 9500 (Sensex 30400-500). 9500 is the make or break area for Nifty as chances of a mean reversion towards 9100 remain open till a sustained move above 9500 is seen.

Sensex / World

Global Equities: Time for Caution

10-July-17
World 1913/ Dollex 3982/ Nikkei 19929/ Nifty 9666/ Sensex 31364

RECAP

In the report of Jun’17, we expected fatigue in Dow near 21600-800, established a long term target of 10800 for Nifty with a pinch of salt in the near term as Nifty valuation seemed close to bubble zone. Shanghai target was set at 3300 and Kospi was expected to appreciate by 10%. As it turns out, Dow has not been able to rise above 21600 so far and Nifty shows early signs of correction in the near term. Shanghai has hit a high of 3193 and Kospi has added 1.5% to its recent gains.


EXECUTIVE SUMMARY

Our latest studies tell us that caution is warranted for the next 3-4 months. Sensex/Nifty outperformance relative to BRIC and the World may be tempered. The Indian markets should be treated cautiously till Oc’17 when Nifty may find a major bottom and resume the larger uptrend for the target of 10800.


World: Time for caution?

MSCI World Index

The chart above shows the MSCI World Index faces immediate resistance near 1950 within long term target of 2015-50 (+4-6%). If and while the Resistance at 1950 holds, we might see a decline of 7% to around 1815. From there, the next rise towards 2050 would still be pending.


Sensex outperformance facing resistance

Sensex / BRIC Sensex / World

The charts above show the continued outperformance of Sensex compared to the BRIC countries and the World but Sensex/BRIC needs a break above 112 and Sensex/World needs a break above 16.5 for continuation of uptrend.


Dollex 30: Time for consolidation?

Dollex-30

One of the major reasons behind our bullishness regarding Nifty is this long term bullish Triangle formation in Dollex 30. Currently the price is testing exactly the final resistance/breakout line but the highly overbought state warrants a breather in the form of a consolidation or a correction. Rest for a quarter would be very healthy for the technical structure and the following rise may be much stronger and sustainable.


Nifty: Target of 10800 may take more time

Nifty monthly

We have been following this long term chart of Nifty which shows the entire rally from the 2008 bottom of 2252 to the current high of 9700 clearly divided into 3 major rallies interrupted by 2 corrective phases. The first part of the current rally from 6826 (black XX) to 8969 took 6 months before a 4-month correction set in. The second part of the rally from 7894 to the life high of 9710 has taken 6 months too and a near to medium term correction may be likely now.


As marked on the chart by red circles, corrections in the uptrend have tended to be 4-month long. If that time pattern is repeated, then the expected correction may run till Oct’17 before the larger uptrend resumes. In that case, our long term target of 10800 may not be met by Sep’17 but by our secondary time target of Mar’18 (both discussed in Jun’17 report).


Nikkei: Will risk-appetite decline for a quarter?

Yen is treated as a global safe haven and an indicator of the risk appetite. Generally Yen weakens and Nikkei rises with increasing risk appetite and vice versa. The long term chart of Nikkei above shows a major resistance near 21000 (about 4% away from the current levels). If Nikkei fails to rise above the major resistance band of 21000-22000 in the coming days, then the risk appetite may dip but the technical formation indicates eventual breakout above 21000-22000 but probably not on the very first attempt. Once again, this chart suggests caution for the next 1-3 months.


CONCLUSION

The major trend remains up for most of the global markets but caution is warranted for the next 3-4 months. While World may appreciate by another 4-6%, it would be prudent to anticipate consolidation/correction which may begin even from the current levels. Any correction in the global markets would affect the Indian markets too but Sensex/Nifty may outperform and be damaged less. A corrective state till Oc’17 is a probable scenario when Nifty may find a major bottom and resume the larger uptrend.

Featured Video Play Icon

Global Equities: Where should you put your money?

Shanghai 3140/ Dow 21136/ Copper 2.54/ KOSPI 2360/ Nifty 9664/ Sensex 31271

RECAP

In our May’17 report, we were waiting to see if Shanghai broke below 2978 within 19th May’17 to confirm resumption of the major bear market. The Dow Jones was expected to rise to 21200-300 and we were watching the Nifty price-action near the make/ break level of 9500. As it turns out, Shanghai did not test 2978 and bounced back from 3016 itself, increasing the possibility of sideways consolidation in the 3000-3300 region. The Dow Jones hit a high of 21112 in May (the target of 21200 was met in early June) and the Nifty broke above 9500 to confirm continuation of the uptrend.


EXECUTIVE SUMMARY

This report examines the fresh bullishness in China (Shanghai), continued outperformance of China by USA and India, strong bullishness in South Korea’s Kospi and continued bullishness in the Nifty in the near term. It ends with a note of longer term caution for the Nifty.


Shanghai moves up, back from the brink

Shanghai Weekly Copper Monthly

Shanghai has been the biggest concern among all the major global markets for a long time and the decline from 3300 over March and April hinted at the possibility of a resumption of the major downtrend from 3684 to 2638 after an 18-month consolidation between 2640 and 3300, forming an up- slanting channel. In May, we were watching to see if the index broke below 2978 within 19th May’17 as the final bearish confirmation but the decline from 3295 ended at 3016 itself, making it a smaller and slower decline compared to the earlier declines inside the channel.

The left side chart shows Shanghai finding buyers at the long term channel support near 3016.  As discussed in the previous report, the bounce from 3016 significantly increases the possibility of the index moving sideways in the range of 3000-3300 for a few months more, with a possible upward extension to 3400 while the channel Support holds.


The right side chart shows the Copper monthly chart. As clearly seen, the decline in the last 4 months has been only a very shallow correction of the previous sharp rally from the Oct ’16 low of 2.08 to the Feb ’17 high of 2.82. It clearly signifies that bears lack any real strength despite the 4 month downtrend. Therefore, a sudden resumption of the larger uptrend is a strong possibility in the coming months. This would be supportive of bullishness in the Shanghai also, given the strong correlation between commodities and Chinese growth.

The negation/ reduction of last month’s bearish scare for the Shanghai is an important bullish development for Global Equities. We look at the US, Indian and Korean markets in the following pages.


USA and India to outperform Shanghai

Dow / Shanghai Sensex / Shanghai

As seen in the previous page, the Shanghai now looks bullish in the near to medium term. In this context, the uptrend in Dow/Shanghai and Sensex/Shanghais ratio indicates that the Dow and Sensex are not only likely to perform better than the Shanghai, they will be much more bullish in themselves.


The left side chart shows the Dow/Shanghai ratio (6.8135). If this manages to sustain above the channel support of 6.60-40, it may rise to 7.50 (+10% from here) in the coming months. The Sensex/Shanghai ratio (10.05) on the right side chart suggests an upside target of 10.50 (appreciation of 4.48% from here) where it can face stiff resistance. As mentioned, with the Shanghai looking bullish and both the US and Indian markets likley to outperform China, both US and Indian equities are likely to continue to rise.


Dow Jones: Strong rise to continue, but time for caution in next 1-3 months?

Dowjones Weekly Fastest Rise

The Dow Jones has been in a tremendous rally since 2009 and the recent momentum since the June’16 low of 17063 has been the greatest in the whole upmove.

While there is no loss of momentum visible yet and the index may well rise to 21600-800 (appreciation of 2-3%), it must be noted that an inability to rise above 21600-800 in the next couple of months may invite a correction of 1000 points or more in the near term. The probability of a near term top near 21800 was discussed in the May’17 report also. A dip of 1000 points in the near term might actually be healthy, and might make room for a further rise towards 22000 over the rest of the year.


South Korea is strongly bullishKospi Weekly

Strong momentum can be seen in the South Korean Kospi which has seen a multi-year breakout this year and may easily rise to resistance near 2500-2600 (appreciation of 10%).

Note that while the Dow Jones has been rising since 2009, the Kospi has been consolidating sideways and has broken out on the upside only recently. The breakout is so strong that after some rest/ consolidation near 2500, the Kospi may have potential to break above 2500 also on rise past 2600 in the coming months.


India may continue to rise for a few more months

Nifty Monthly

The long term chart of Nifty shows the entire rally from the 2008 bottom of 2252 to the current high of 9700 can be clearly divided into 3 major rallies interrupted by 2 corrective phases. The first rally from 2252 to 6338 (O to W) is almost perfectly equal to the second rally from 5119 to 9119 (X to Y), as shown on the chart above. The magnitude of first 2 rallies is about 4000 points, which projected from the 2016 bottom (XX) of 6826 gives us targets of 10826-10912.


The first rally (X to Y) had taken 25 months and the second rally (X to Y) took 19 months. This June is the 16th month of the current rally (from XX towards Z). Therefore if the target of 10800 (appreciation of 11-12%) is not met by Sep’17, then the rise can extend to Mar’18 before a major top can be expected.


However, we also note that while the Nifty can rise for a few more months, it is now entering into bubble zone.


Nifty P/E enters bubble territory

Nifty Log and Nifty PE

The chart above tracks the Nifty PE (green line, LHS) and Nifty Log Chart (blue line, RHS) since 1999. It clearly shows that the Nifty PE has just entered the bubble territory (23.5-26.5). While it doesn’t mean that an immediate correction is pending, it is definitely a signal to stay cautious over the next 2-4 months as the PE may top out anywhere between 25-27 and a subsequent decline can bring the PE down to 20-19 levels, dragging the Nifty down also. Of course, while this something that is likely to play out in the medium to long-term, not immediately, it is something to keep in mind.


Conclusion

Shanghai may be on a much firmer footing than most market participants believe and may rise to 3300 in the coming months and even higher levels may come under consideration. Both the US and Indian markets are likely to outperform China market but caution is warranted at the higher levels. Dow may show signs of fatigue near 21600-800 (appreciation of 2-3%) while more upside may be left for the Asian markets. Kospi, one of the strongest indices now, may rise another 10% before any major top which is very similar to the long term target of Nifty at 10800-900 (about 11-12% higher). In the longer term, we have to be careful not to get carried away with the bullishness in the Nifty as it has entered bubble territory already.

Sensex/World

Global Equities: Something for both Bulls and Bears

4-August-17
Dow 22026/ Sensex 32325

RECAP

In the report of Jul’17, we talked about caution for 3-4 months and expected relative underperformance of Sensex against BRIC and World. It was suggested that the Indian market be treated with caution till Oct’17. Despite the expected underperformance against other indices, Sensex itself has gained over 4% since our Jul’17 report.


EXECUTIVE SUMMARY

The expected correction in the global markets has not materialized yet but the time for caution is also not past yet. At the same time, while we are cautious, some bullish factors (like weakening Gold/Copper ratio, and other emerging markets attracting strong inflows) are cropping up which may support increasing risk-appetite not only at the current high levels but even higher. Sensex underperformance relative to BRIC and World may continue.


DOW: FACING MAJOR RESISTANCE

Djia Quarterly candlesThe rise of Dow from the 2009 low of 6470 to current high of 21681 can be divided into 3 major rallies. The current rally (upper red box) achieves equality with the first rally (lower red box) at 21813, only 0.6% higher from the current high of 21681. This projection equality coupled with the long term trendline resistance near 22100 makes 21800-22100 a formidable resistance and a place to be cautious.


SENSEX: TIME FOR CAUTION

Sensex QuarterlyA similar combination of long term trendline resistance and equality projection can be seen in Sensex above. The current rally from 25754 (black box) achieves equality with the earlier rally from 22495 to 29077 (blue box) at 32300. The trendline resistance comes slightly higher at 32850-900. Therefore unless Sensex rises above 32900, downside risks cannot be negated completely and caution is recommended.


SENSEX MAY UNDERPERFORM BRIC AND WORLD

Sensex BRIC Aug17   Sensex/World Aug17

The left chart shows Sensex/BRIC suffering a sharp rejection from 112 and the right side chart shows Sensex/World coming down from 16.5. Both the resistances were discussed in the July’17 report and the failure there signals possible underperformance of Sensex against BRIC and World in the near to medium term.


Mexico IPC Qtly

The Emerging markets markets are seeing a lot of inflow and even a country like Mexico, which stands in a direct conflict with the President Trump of the USA (its most important neighbor and trading partner), is seeing major gains. As seen above, the Trump Presidency has failed to negatively impact Mexican equities. Contrarily, it seems to have been beneficial for Mexican equities.


TURKEY: BREAKOUT FROM MULTI-YEAR TRIANGLE CONSOLIDATION

Turkey ISE Qtly

Turkey is another country where the global perception about its economy has failed. The country has been in a phase of intense political disturbance in the last few months but it seems that the turmoil has actually helped the equity market to end its multi-year consolidation and resume the long term uptrend in a very sharp manner.

2016 saw a failed coup by a faction of the army, terrorist attacks and the Turkish Lira coming under intense pressure but a large government stimulus has helped the GDP to recover from -1.8% (Dec’16) to +5% (Mar’17) and boosted equities. Despite the fear of it turning to be a “gray rhino”, the index may rise another 10% in the coming quarters.


SHANGHAI: PERSISTENT UPTREND

Shanghai 3Day Candles

Despite all the worries about the Chinese economy, the Shanghai Index trades near a 19-month high. As long as the support at 3150 holds, the trend remains firmly up and a break above 3300 may open up 3450-3500, appreciation of another 4.5-6.0%. If China remains strong, the risk scenario could improve further.

We examine below two fundamental factors that are encouraging for global growth as a whole.


CHINA: RECOVERING FROM SLOWDOWN?

China GDPThe world spent 2016 fearing a “hard landing” in China as the authorities tried to transition from an investment led economy to a consumption led economy.

However, as the chart above shows, growth seems to be picking up again in 2017 after a continuous decline since 2012. The Q2FY 2017 GDP came at 6.9% (yoy), better than the expected 6.8%. The Q3 and Q4 consensus forecasts stand at 6.7% and 6.6% currently, and could be revised upwards in the coming weeks, given that the Chinese PMI has seen a sharp pickup to 51.1 in July, compared to 50.4 and 49.6 in the earlier months.


GOLD-COPPER RATIO: FRESH RISK-ON?

Gold/CopperThis chart shows that the Gold-Copper ratio (currently 439) is standing at a very important inflection point. A weekly close below the long-term channel support at 430 opens up much lower levels of 380-60, signaling increasing global risk appetite and stronger belief in the stability of the world economy. 

Why does this matter? When the Gold-Copper ratio comes down, it implies more demand for Copper relative to Gold. This usually happens when either (a) there is lesser demand for Gold as a “safe haven” or (b) there is more industrial demand for Copper, or both. In either case, a decline in the Gold-Copper ratio is generally interpreted as a symptom of increase in global growth rates.


FOLLOW-UP ON KOSPI: TIME TO BE CAUTIOUS

Kospi Weekly

This is a follow-up on the South Korean Kospi, which was last discussed in our Jun’17 report. It was written that the index may rise to 2500-2600 soon and in line with our expectations, the index has indeed hit a high of 2453 in July with 2500 in touching distance now. We had also discussed the possibility of a consolidation near 2500 and the time for that consolidation phase looks near and the long term bulls may take some profit away from the table.

Keeping with our previous view, we may see a multi-month consolidation if the index fails to rise above 2500 but the long term uptrend may resume for 2600 and higher in the months following the correction.


CONCLUSION

Despite the US and Indian markets running the risk of severe correction in the near term, we must allow for the possibility of further upside before the expected correction materializes. The continued inflow into even unlikely emerging markets like Mexico and Turkey and the rally in industrial metals relative to safe havens like Gold point to still increasing risk appetite which may push the indices higher.