

The Shoulder Head Shoulder chart pattern
Aug, 25, 2004 By Vikram Murarka 0 comments

A common mistake
The Shoulder-Head-Shoulder is one of the most popular Reversal patterns in classical charting as it is visually appealing and promises handsome gains if read correctly. Sometimes, Chartists tend to make a common mistake in reading it though, as illustrated below:
 |
 |
The fault lay not in the chart pattern, but in the initial reading. A very important point to remember about SHS is that the profit objective from the Neckline is roughly equal to the distance between the Head and the Neckline. As such the previous trend should have been of a sufficiently long duration to accommodate the profit objective. Further, since the SHS is a Trend Reversal pattern (not a Trend Correction pattern), there should ideally be further room available (beyond the profit objective) for the new trend to perpetuate. These conditions were not met in this case of a "false" SHS.
 The Charts aren't perfect, though
Of course, It does happen sometimes, that even a Classical SHS, meeting the conditions mentioned, does not deliver to its full potential, as seen alongside. The GBPUSD had developed a pronounced Bear SHS in Q1-04, with an ideal Profit Objective near 1.7150. Unfortunately, the low seen was only 1.7480 on 14-May-04, well short of the target.
Since Charting is not an exact science, the only way to deal with this would have been to employ a Trailing Stop Loss to protect Short positions. This is the realm of skilful Trading, an ability acquired with effort and experience.

You may also like:

In our last report (27-Feb-26, UST10Yr 4.01%), which was published just one day before the start of the US-Israel-Iran War on 28-Feb, we had continued to target 4.60% on the US10Yr based on expectations of higher Crude. At that time, we were looking for Brent to rise …. Read More

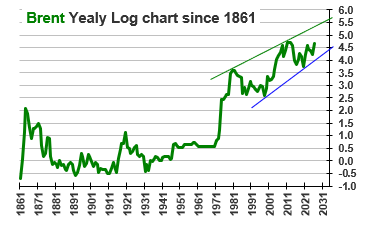
The escalation of war between US and Iran throughout March-26 has led to a rally in Brent prices to as high as $119.50, exceeding our bullish targets by a large margin, much ahead of expected time. Will it remain bullish for the coming years?… Read More

Our view of a fall towards 1.14 seems to be playing out well so far as the tensions in the Middle East and the US-Iran conflict have triggered a rise in Dollar Index and crude oil prices, thereby weakening to Euro to 1.1507 so far in Mar-26. Will it again attempt to rise targeting 1.20? Or will it remain below 1.19/20 now and see an eventual decline to 1.10? …. Read More
In our 09-Mar-26 report (10Yr GOI 6.69%) we had warned that the sharp rise in crude due to the US-Iran conflict could push Brent toward $134, which would lift CPI toward ~6.2%, eliminating any chance of RBI easing, and potentially force tightening. This inflation shock, along with higher US yields, was expected to push the 10Yr GOI up to … Read More

In our 10-Dec-25 report (USDJPY 156.70), we expected the USDJPY to trade within 154-158 region till Jan’26 before eventually rising in the long run. In line with our view, the pair limited the downside to … Read More

Our March ’26 Dollar Rupee Monthly Forecast is now available. To order a PAID copy, please click here and take a trial of our service.