

Rupee Forecasting - The KSHITIJ Way
Aug, 18, 2020 By Vikram Murarka 0 comments


To see where the Indian Rupee is going we look at 50 factors. Yes, you read it right, 50 factors.

Those include global currencies (Euro, EM Currencies etc), equities (Dow Jones, MSCI EM indices etc), commodities (Gold, copper, oil etc), bonds (US Treasury, TED Spread etc) and fundamental data.
Correlation studies and inter-market relationships also form a major part of our analysis.
The extensive study we do on all these factors helps us gauge where the Rupee is going, but we don't stop here. We also record all our forecasts and conduct performance reviews in order to make continuous improvements and minimize errors in what we do.

Direction and Timing of Forecasts
Over the years, many of our clients have asked us why, when we publish forecasts, sometimes we predict the direction of the movement correctly, the timing of our prediction is incorrect.
Here, we wish to provide some clarity in that regard.
Tools Used in Kshitij Charts
Some of the basic tools that we at Kshitij use in our charts for our analysis are: 1. Trendlines 2. Candles 3. Moving Averages 4. Line Charts Most of our charts are very simple with only the above mentioned basic tools. We do not use many oscillators or momentum indicators either.
The Reliability of Kshitij Forecasts
Through our currency forecasts and hedging strategies, we like to think that we provide a sense of reliability to our clients. This is most manifest in the 14-year track record of our Dollar-Rupee forecasts, the first, and to our knowledge, still the only one of its kind in India, which proves in real, verifiable numbers, a reliability of 74%.

Rupee Forecasting - Advanced Techniques - The KSHITIJ Way
To see where the Indian Rupee is going we look at 50 factors. Yes, you read it right, 50 factors. Those include global currencies (Euro, EM Currencies etc), equities (Dow Jones, MSCI EM indices etc), commodities (Gold, copper, oil etc), bonds (US Treasury, TED Spread etc) and fundamental data. Correlation studies and inter-market relationships also form a major part of our analysis. The extensive study we do on all these factors helps us gauge where the Rupee is going, but we don't stop here. We also record all our forecasts and conduct performance reviews in order to make continuous improvements and minimize errors in what we do.


In our last report (27-Feb-26, UST10Yr 4.01%), which was published just one day before the start of the US-Israel-Iran War on 28-Feb, we had continued to target 4.60% on the US10Yr based on expectations of higher Crude. At that time, we were looking for Brent to rise …. Read More

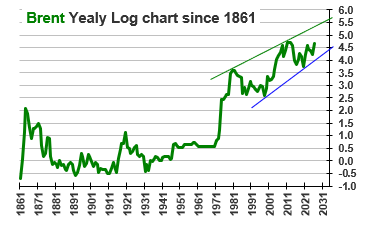
The escalation of war between US and Iran throughout March-26 has led to a rally in Brent prices to as high as $119.50, exceeding our bullish targets by a large margin, much ahead of expected time. Will it remain bullish for the coming years?… Read More

Our view of a fall towards 1.14 seems to be playing out well so far as the tensions in the Middle East and the US-Iran conflict have triggered a rise in Dollar Index and crude oil prices, thereby weakening to Euro to 1.1507 so far in Mar-26. Will it again attempt to rise targeting 1.20? Or will it remain below 1.19/20 now and see an eventual decline to 1.10? …. Read More
In our 09-Mar-26 report (10Yr GOI 6.69%) we had warned that the sharp rise in crude due to the US-Iran conflict could push Brent toward $134, which would lift CPI toward ~6.2%, eliminating any chance of RBI easing, and potentially force tightening. This inflation shock, along with higher US yields, was expected to push the 10Yr GOI up to … Read More

In our 10-Dec-25 report (USDJPY 156.70), we expected the USDJPY to trade within 154-158 region till Jan’26 before eventually rising in the long run. In line with our view, the pair limited the downside to … Read More

Our March ’26 Dollar Rupee Monthly Forecast is now available. To order a PAID copy, please click here and take a trial of our service.