Mastering Currency Forecasting
Dec, 30, 2020 By Vikram Murarka 0 comments

30-Dec'20
Even in today’s Brave New World, many people still believe that currencies cannot be forecasted and many forex hedgers believe that forecasting the currency movement is not part of their job.

We believe otherwise. Our track record of 14+ years in both forecasting Dollar-Rupee and in hedging Dollar-Rupee exposures shows that it can be done.
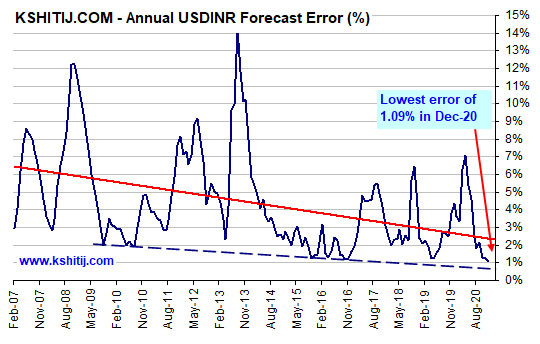
In fact, at 1.09%, our Dec-20 forecast error for Dollar-Rupee is the lowest we’ve had in the last 14+ years.
Here we share with you how we think forecasting currency movements can be mastered.
Believe. Then you can make it happen.
You have to first believe that currency forecasting is possible. If we think forecasting is not possible or that trying to figure out where the market will go is a mug’s game, then we are never going to become good at forecasting. Let me make it easy for you right at this stage. 100% accuracy in forecasting is neither needed, nor is it possible. When we make forecasts, we are also going to make mistakes. That is part of the game. A strike rate greater than 60% or “Reliability” greater than 60% is good enough to make you a winner; and then of course we can aim to increase the reliability towards 70% or 80%.
Making mistakes. And the kinds of mistakes
While mistakes are part of the game, aiming for better forecasts is nothing other than aiming to reduce mistakes. Greater reliability comes from reducing mistakes. More mistakes, less reliability. Less mistakes, more reliability.
Where do mistakes come from? How do we reduce them? Mistakes come from (a) inexperience (b) negligence (c) our biases (d) errors of judgement and finally (e) surprises.
Mistakes that arise from (A) inexperience are generally reduced with time, with experience. Mistakes arising from (B) sheer negligence are rightfully reduced through punishment by the markets, by incurring losses. No one is immune from this. Thankfully, the market is both ruthless in meting out punishment and unhesitating in handing out rewards. Reducing mistakes from inexperience and negligence can get us up to 40% reliability. Working on (C ) our biases, can help us get ourselves up to 50-55%.
The first two are the easiest to achieve. And working on our biases is also relatively easy, as we will show how later on.
Working on (D) errors of judgement is much more difficult. To the extent we can reduce them, we can move from 55% to 70%. Finally, the last 30% bit due to (E) surprises is something we can only hope to reduce but may never fully escape. That said, if we get our reliability up to 80%, we will be super-forecasters in any case. How can we work on (C ) our biases and (D) errors of judgement?
Reducing biases and errors of judgement
- Look at long histories
When looking at charts, look at long histories. The longer the history, the better. Many people base their forecasts on just whatever chart is available in front of them. In his book, “Thinking, Fast and Slow” Daniel Kahneman has termed this as the WYSIATI Bias, or the What-You-See-Is-All-There-Is bias. It says that most people tend to arrive at conclusion by looking at whatever limited data or evidence is present in front of them, instead of looking for more and more data or evidence before drawing up a conclusion.
We regularly look at monthly, bi-monthly and quarterly charts, even yearly charts; and we ideally we would like to go back 40-50-60 years at least. The longer the history, the better we can identify longer term trends and patterns and can therefore better understand the context of the current price movement.
- Look at many variables
When we forecast Dollar-Rupee, we consciously like to look at many other variables. In fact we study some 60 variables while working on our Dollar-Rupee forecasts. The thought process is, if the inferences from a number of variables converge on the same conclusion, we can assume that conclusion to be more reliable.
- Correlations can be very helpful
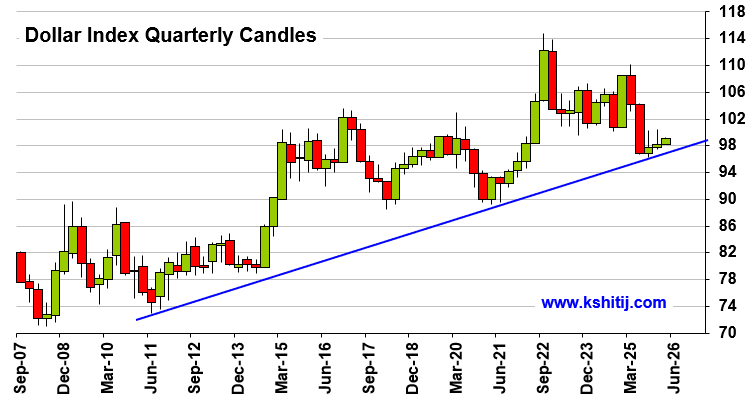
Look for correlations among different market variables. You would be surprised how, many a times, we get clues about the variable we want to track from the chart of a different variable! Having figured that, use the correlation to work backwards to the desired variable. Common examples are the need to study the Dow Jones to figure out the Sensex or the Nifty, and to study the Dollar Index and Euro to figure out Dollar-Rupee. There can be many more. It is interesting to keep an eye open for possible correlations.
- Ratio Charts are a must
Besides studying the correlation charts between variables, it is imperative to study the ratio charts between variables. If the Euro-Dollar is expected to hit level X and the Euro-Rupee ratio chart is likely to hit level Y, then a simple Y/X division will give us a projection for Dollar-Rupee. People have scoffed at us for doing things like these, but we know that it has helped us improve. How? When we do this exercise across a number of different variables, it gives us a rather reliable average for a possible Dollar-Rupee rate, because each ratio relationship acts as a check upon on all the others. If they are all converging within a relatively narrow range, that is good and reliable. If any of the ratio studies throws up a projection that seems to be far from the average, it alerts us to the possibility of a mistake in our chart reading, or that perhaps some deep-seated bias is rearing its head and needs to be nipped in the bud.
- Do not restrict to only one technique
When studying the charts, we do not restrict ourselves to only one technique of technical analysis. We use classical charting using trendlines. We use Moving Averages; and we also use Elliot Waves. As in case of looking at many variables, the thought process behind employing two-three different techniques is that if the inferences from a number of techniques converge on the same conclusion, we can assume that to be more reliable.
Are we overdoing it?
Why do we look at long histories, many time frames, correlations, ratios and why do we use three different techniques? Sherlock Holmes puts together many different pieces of evidence, brings in knowledge of many disciplines and sciences and is never in a hurry to jump to a conclusion. This, despite having a super-sharp brain and legendary abilities of observation and discernment. Why does he put in so much of hard work? He is not operating in the 50% correct zone. He does all this just to check, check and re-check to make sure that he does not allow any of his biases to come in the way and to avoid errors of judgement. All our studies are also aimed at avoiding these mistakes.
How about doing some things the books don’t tell you to do
Many, if not all, of the foregoing techniques might be known to a lot of people, whether or not they use all of them. Here are some “new” things that we have been doing to help us increase the reliability of our forecasts.
- a) Look at the Time Axis
Most of the time, or truly speaking almost all the time, people look at only the Price-axis or the Y-axis of a chart and spend almost zero time on looking at the Time-axis or the X-axis. In other words, most of the time people are only trying to forecast the Trend and the Target of a currency. We have to try and figure out how much time will be taken to reach the forecasted price levels, otherwise the forecast is not very meaningful. In order to get an idea of Time, we have to, obviously look at the X-axis (time) also. Although looking at the X-axis and forming an idea about Time takes effort, practice, and quite frankly it takes time, it is imperative to develop this ability. It is also very useful in meaningful cross-market analysis and deriving inferences from ratio charts.
- b) Look at Maths and Stats as well
Look at the simple maths and stats behind the currency movement. For example, how much does the market tend to move, on average, in 1 month? Or 3 months? We call this measure the Amplitude, which is akin, perhaps to Average True Range. It is simply the difference between the High and the Low. It is remarkable as to how much most people underestimate volatility. Tracking the Amplitude is imperative to get an idea about volatility. Make a histogram of observed amplitudes over the past history. Work out the average amplitude that can be expected. This is very useful in making price projections. There can be many more examples, but this is one of the simplest.
- c) Track your performance
This cannot be overemphasized. If you want to improve, you have to start tracking your performance. Without that, there is no way you are going to make any meaningful progress. Of course, tracking your performance means bringing in discipline to note down your analysis and it calls for the guts to face the errors you have made. It is both hard work and it hurts the ego. However, do remember that error-tracking or performance measurement is the essential difference between being a hobbyist or a professional. If you are really serious about improving your forecasts, our best advice would be to start tracking your errors.
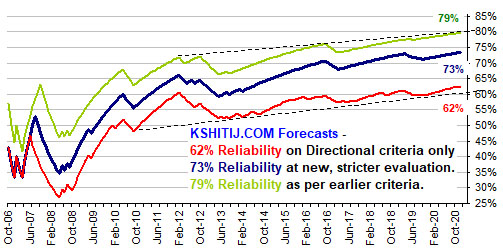
We have been diligently tracking our errors for the last 14 years. We devised our own error-tracking protocols and have kept making it tighter for ourselves over the years. This has helped us improve tremendously, such that our Dollar-Rupee Reliability has improved from 35% in 2006 to 73% in 2020.
- d) Take time
Take time to make your long-term forecasts. Keep them in mind. This is very important. Do not make a forecast and forget it. If you have done your analysis carefully, there is a high chance that your forecast will be right. Have that confidence. Then see how the short-term market movements are fitting into your long-term forecasts.
- e) Look left. Then right. Then left again. And then cross the road.
Make conscious effort to work out the alternate scenario with nearly as much dedication as painting your preferred scenario. Assign probabilities to these alternative scenarios using age old rules of (a) honouring trendlines, (b) “trend is your friend” and (c) figuring out the path of least resistance.
Remember, the starting working assumption in classical charting should be that a trendline will hold. Do not pre-empt the break of a trendline, unless you have ample reason to do so. Further, the trendlines on longer term charts have greater chances of holding. They deserve that respect. Remember these trendlines in your mind.
So much of hard work? For what?
After doing all this, our forecasts on Rupee, Euro and Crude are showing a Reliability of more than 70%. You might think what is the point of undertaking all this hard work if you get a reliability of only 73%? The counter to that is, you will be confined to the 50-55% region if you do not put in this work.
Now, we have to try and figure out how to move up to 80% and past that. Ah well, who said life was supposed to become easier?
Array
In our last report (29-Dec-25, UST10Yr 4.12%) we had said the US2Yr could fall to 3.00%. However, contrary to our expectation, the US2Yr has moved up. The US10Yr has also risen, much earlier than …. Read More
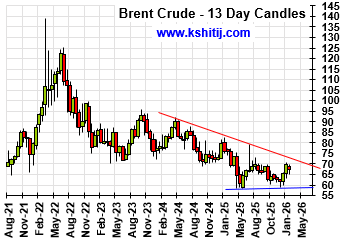
Having risen sharply in Jan-26 to $70.58, will Brent again rise past $70 and continue to rise in the coming months? Or is the rise over and the price can move back towards $60? … Read More
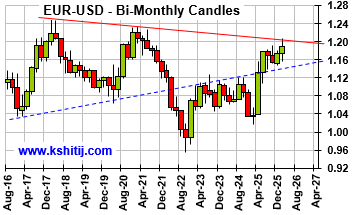
Euro unexpectedly reached 1.2083 in Jan-26 on Dollar sell-off but recovered quickly back to lower levels. Will it again attempt to rise targeting 1.24? Or will it remain below 1.20/21 now and see an eventual decline to 1.10/08? …. Read More
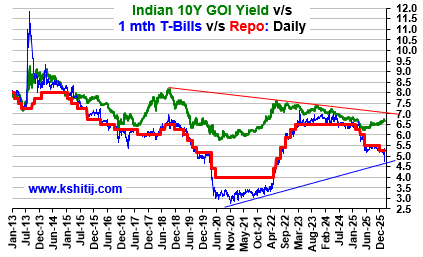
The 10Yr GOI (6.6472%) had risen to a high of 6.78% on 01-Feb. It has dipped a bit from there but has good Support at … Read More
In our 10-Dec-25 report (USDJPY 156.70), we expected the USDJPY to trade within 154-158 region till Jan’26 before eventually rising in the long run. In line with our view, the pair limited the downside to … Read More
Our February ’26 Dollar Rupee Monthly Forecast is now available. To order a PAID copy, please click here and take a trial of our service.
- Kshitij Consultancy Services
- Email: info@kshitij.com
- Ph: 00-91-33-24892010
- Mobile: +91 9073942877


