Global Equities: Where should you put your money?
Jun, 09, 2017 By Ranajay Banerjee 5 comments

Shanghai 3140/ Dow 21136/ Copper 2.54/ KOSPI 2360/ Nifty 9664/ Sensex 31271
RECAP
In our May’17 report, we were waiting to see if Shanghai broke below 2978 within 19th May’17 to confirm resumption of the major bear market. The Dow Jones was expected to rise to 21200-300 and we were watching the Nifty price-action near the make/ break level of 9500. As it turns out, Shanghai did not test 2978 and bounced back from 3016 itself, increasing the possibility of sideways consolidation in the 3000-3300 region. The Dow Jones hit a high of 21112 in May (the target of 21200 was met in early June) and the Nifty broke above 9500 to confirm continuation of the uptrend.
EXECUTIVE SUMMARY
This report examines the fresh bullishness in China (Shanghai), continued outperformance of China by USA and India, strong bullishness in South Korea’s Kospi and continued bullishness in the Nifty in the near term. It ends with a note of longer term caution for the Nifty.
Shanghai moves up, back from the brink
 |
 |
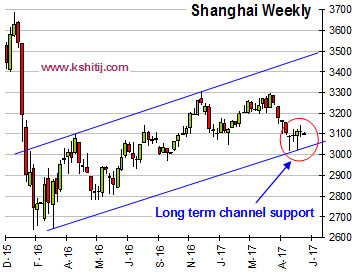
Shanghai has been the biggest concern among all the major global markets for a long time and the decline from 3300 over March and April hinted at the possibility of a resumption of the major downtrend from 3684 to 2638 after an 18-month consolidation between 2640 and 3300, forming an up- slanting channel. In May, we were watching to see if the index broke below 2978 within 19th May’17 as the final bearish confirmation but the decline from 3295 ended at 3016 itself, making it a smaller and slower decline compared to the earlier declines inside the channel.
The left side chart shows Shanghai finding buyers at the long term channel support near 3016. As discussed in the previous report, the bounce from 3016 significantly increases the possibility of the index moving sideways in the range of 3000-3300 for a few months more, with a possible upward extension to 3400 while the channel Support holds.
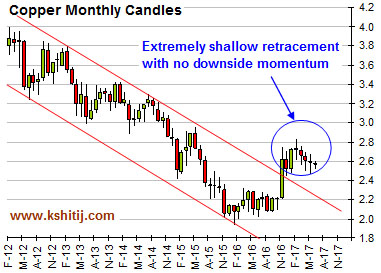
The right side chart shows the Copper monthly chart. As clearly seen, the decline in the last 4 months has been only a very shallow correction of the previous sharp rally from the Oct ’16 low of 2.08 to the Feb ’17 high of 2.82. It clearly signifies that bears lack any real strength despite the 4 month downtrend. Therefore, a sudden resumption of the larger uptrend is a strong possibility in the coming months. This would be supportive of bullishness in the Shanghai also, given the strong correlation between commodities and Chinese growth.
The negation/ reduction of last month’s bearish scare for the Shanghai is an important bullish development for Global Equities. We look at the US, Indian and Korean markets in the following pages.
USA and India to outperform Shanghai
 |
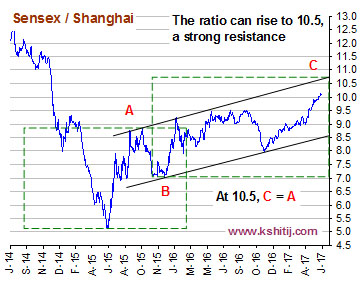 |
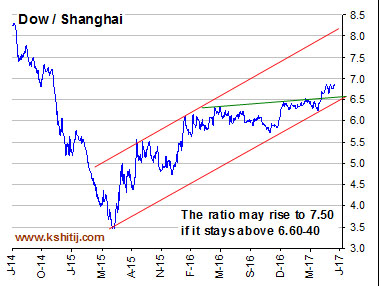
As seen in the previous page, the Shanghai now looks bullish in the near to medium term. In this context, the uptrend in Dow/Shanghai and Sensex/Shanghais ratio indicates that the Dow and Sensex are not only likely to perform better than the Shanghai, they will be much more bullish in themselves.
The left side chart shows the Dow/Shanghai ratio (6.8135). If this manages to sustain above the channel support of 6.60-40, it may rise to 7.50 (+10% from here) in the coming months. The Sensex/Shanghai ratio (10.05) on the right side chart suggests an upside target of 10.50 (appreciation of 4.48% from here) where it can face stiff resistance. As mentioned, with the Shanghai looking bullish and both the US and Indian markets likley to outperform China, both US and Indian equities are likely to continue to rise.
Dow Jones: Strong rise to continue, but time for caution in next 1-3 months?
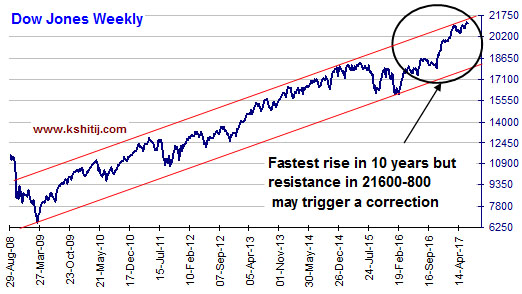
The Dow Jones has been in a tremendous rally since 2009 and the recent momentum since the June’16 low of 17063 has been the greatest in the whole upmove.
While there is no loss of momentum visible yet and the index may well rise to 21600-800 (appreciation of 2-3%), it must be noted that an inability to rise above 21600-800 in the next couple of months may invite a correction of 1000 points or more in the near term. The probability of a near term top near 21800 was discussed in the May’17 report also. A dip of 1000 points in the near term might actually be healthy, and might make room for a further rise towards 22000 over the rest of the year.
South Korea is strongly bullish
Strong momentum can be seen in the South Korean Kospi which has seen a multi-year breakout this year and may easily rise to resistance near 2500-2600 (appreciation of 10%).
Note that while the Dow Jones has been rising since 2009, the Kospi has been consolidating sideways and has broken out on the upside only recently. The breakout is so strong that after some rest/ consolidation near 2500, the Kospi may have potential to break above 2500 also on rise past 2600 in the coming months.
India may continue to rise for a few more months
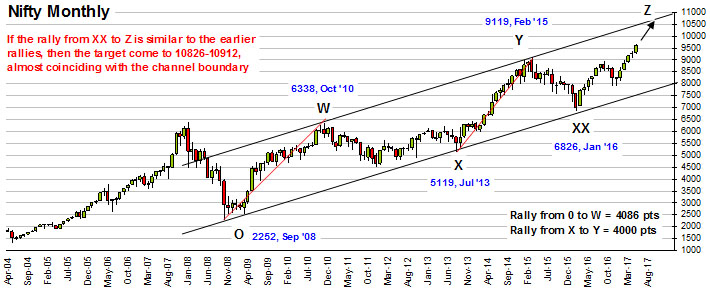
The long term chart of Nifty shows the entire rally from the 2008 bottom of 2252 to the current high of 9700 can be clearly divided into 3 major rallies interrupted by 2 corrective phases. The first rally from 2252 to 6338 (O to W) is almost perfectly equal to the second rally from 5119 to 9119 (X to Y), as shown on the chart above. The magnitude of first 2 rallies is about 4000 points, which projected from the 2016 bottom (XX) of 6826 gives us targets of 10826-10912.
The first rally (X to Y) had taken 25 months and the second rally (X to Y) took 19 months. This June is the 16th month of the current rally (from XX towards Z). Therefore if the target of 10800 (appreciation of 11-12%) is not met by Sep’17, then the rise can extend to Mar’18 before a major top can be expected.
However, we also note that while the Nifty can rise for a few more months, it is now entering into bubble zone.
Nifty P/E enters bubble territory
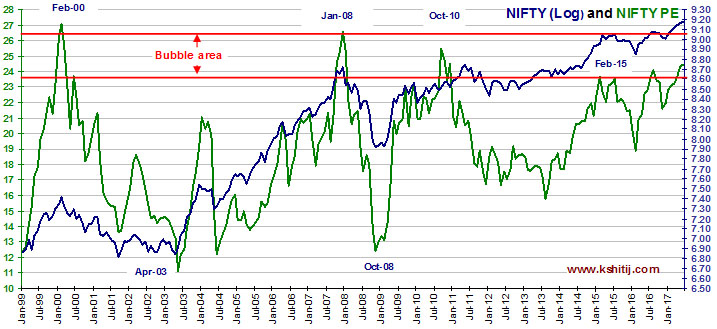
The chart above tracks the Nifty PE (green line, LHS) and Nifty Log Chart (blue line, RHS) since 1999. It clearly shows that the Nifty PE has just entered the bubble territory (23.5-26.5). While it doesn’t mean that an immediate correction is pending, it is definitely a signal to stay cautious over the next 2-4 months as the PE may top out anywhere between 25-27 and a subsequent decline can bring the PE down to 20-19 levels, dragging the Nifty down also. Of course, while this something that is likely to play out in the medium to long-term, not immediately, it is something to keep in mind.
Conclusion
Shanghai may be on a much firmer footing than most market participants believe and may rise to 3300 in the coming months and even higher levels may come under consideration. Both the US and Indian markets are likely to outperform China market but caution is warranted at the higher levels. Dow may show signs of fatigue near 21600-800 (appreciation of 2-3%) while more upside may be left for the Asian markets. Kospi, one of the strongest indices now, may rise another 10% before any major top which is very similar to the long term target of Nifty at 10800-900 (about 11-12% higher). In the longer term, we have to be careful not to get carried away with the bullishness in the Nifty as it has entered bubble territory already.

Ranajay Banerjee
Leads the research team at KSHITIJ,COM. Has a deep understanding of Elliot Waves and a formidable memory of market history. Well known on Twitter as @ranajayb with a considerable fan following. Film scriptwriter by night.
Array
In our last report (29-Dec-25, UST10Yr 4.12%) we had said the US2Yr could fall to 3.00%. However, contrary to our expectation, the US2Yr has moved up. The US10Yr has also risen, much earlier than …. Read More
Having risen sharply in Jan-26 to $70.58, will Brent again rise past $70 and continue to rise in the coming months? Or is the rise over and the price can move back towards $60? … Read More
Euro unexpectedly reached 1.2083 in Jan-26 on Dollar sell-off but recovered quickly back to lower levels. Will it again attempt to rise targeting 1.24? Or will it remain below 1.20/21 now and see an eventual decline to 1.10/08? …. Read More
The 10Yr GOI (6.6472%) had risen to a high of 6.78% on 01-Feb. It has dipped a bit from there but has good Support at … Read More
In our 10-Dec-25 report (USDJPY 156.70), we expected the USDJPY to trade within 154-158 region till Jan’26 before eventually rising in the long run. In line with our view, the pair limited the downside to … Read More
Our February ’26 Dollar Rupee Monthly Forecast is now available. To order a PAID copy, please click here and take a trial of our service.
- Kshitij Consultancy Services
- Email: info@kshitij.com
- Ph: 00-91-33-24892010
- Mobile: +91 9073942877


