Global Equities: Time for a breather?
Apr, 17, 2017 By Ranajay Banerjee 0 comments


Dow 20453 / World 1843/ BRIC 270 / Nifty 9150 / Russell 2k 1345
The global equities are seeing a booming bull market, ignoring all the anxiety, worries and distrust among pundits. As the market adage goes, “a bull market climbs the wall of worries”. The current bull markets in the US and India are doing just that.
Within this context, the major uptrend may consolidate for a few months before climbing to greater heights. In this report we examine the outlook for the US markets, the World Index, the BRIC Index and Indian equities.
EXECUTIVE SUMMARY:
The global equity markets are in a strong uptrend and the rise may continue in the long term, but in the near term, the markets may take a long overdue rest as the overextended price needs to come down a bit before the rally can extend to the higher levels. We check both Dow Jones and Russell 2000 for the US market, the World Index, MSCI BRIC and Nifty, all of which point towards a rest period in the next few months.
Dow Jones: Higher chances of rally continuation
As seen above, the Dow has dipped from a channel resistance. As per Elliot Waves, the (3)rd of the 3rd might have gotten over at 21169 in early March, near the trendline and if so, a corrective dip towards 20450-20050 may be seen before the 5th of 3rd may start. Alternatively, the 3rd of 3rd may still continue till 21800 or even 22000-400 before any significant correction emerges. But as long as the resistance at 21100 holds, a dip towards 20450-20050 may be more likely. The greater chance of a correction is suggested by the broader small cap universe, the Russell 2000 Index below.
Russell 2000 – Broader market index
The Russell 2000 is a good indicator of the broader market strength of US equities, and it closely follows Dow Jones. As the log chart above clearly shows, the index is facing rejection at a 17-year old channel resistance and may find it difficult to break above 1420 immediately. As long as Russell 2000 stays contained, Dow may struggle to rise too.
World, Long Term: Strongly bullish but testing resistance
The chart above shows the MSCI World Index testing the long term resistance near 1850 which may not give way in the very first attempt and may produce a dip to 1750. That said, the overall uptrend remains intact while above 1750.
MSCI BRIC Index:
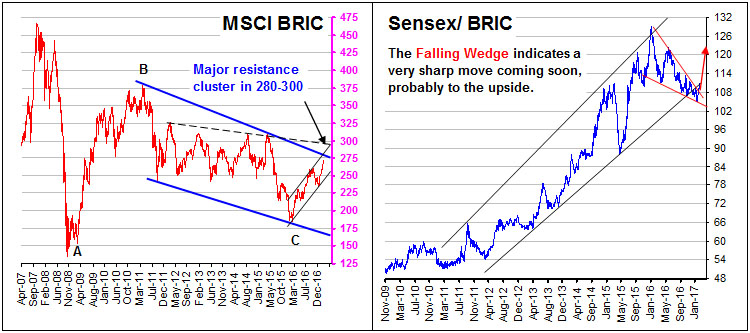
A similar kind of resistance is seen on the MSCI BRIC Index also, as evident from the left side chart above. The index may struggle near the resistance at 280-300 for a while before breaking above 300 successfully. In the meanwhile, Sensex may outperform the BRIC as signaled by the Sensex/BRIC chart on the right hand side. The falling Wedge formation indicates severe lack of downside momentum and a strong possibility of a breakout to the upside targeting 325-50. That said, while the Sensex may be in a huge bull market, it may also first take a pause for a few months.
Nifty long term: Shallow correction likely before huge rally
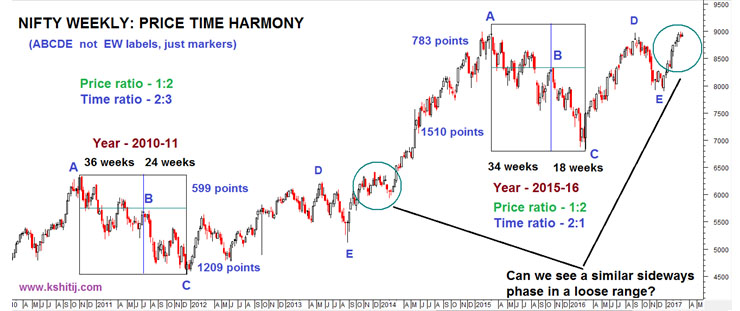
The chart above essentially shows the similarity of the two corrective phases seen in 2010-11 and 2015-16. If the two major corrective phases are similar, then the following price action may be expected to unfold”
In the first corrective phase in 2010-11, the correction from 6339 (A) to 4531 (C) was clearly divided into two clear parts (marked by blue AB and BC). Price wise, AB was 599 points against 1209 points of BC, a nice ratio of 1:2. Time taken by AB was 36 weeks against 24 weeks taken by BC, again a perfect ratio of 3:2. Both the time and price implied strong geometry at work which confirmed the bottom and unleashed the next bull market.
In the second corrective phase (2015-16), a similar market geometry was at work. Again, the entire decline from 9119 (A) to 6825 (C) was divided into 2 clear parts with the price ratio approaching 1:2 and the time ratio matching the price ratio here was 2:1.
This kind of price-time harmony generally indicates very significant top or bottom and in the first case, Nifty had doubled from the low of 4531 in the year 2011 to 9119 by year 2015. In the current and second instance, an appreciation of more than 30% has already been seen from the 2016 low of 6825 to the high of 8969 in the same year.
In the first instance, the initial rally from 4531 topped out at 6229 (D), about 1.6% lower from the previous high of 6339 (A). Similar rally and top was seen in 2016 too, as the rally from 6825 topped out at 8969 (marked by D), again 1.6% lower from the previous high of 9119 (A). In both the cases, corrections of 1100 points took place (marked by E).
If the list of these similarities continues in the same way, then we may expect the current bounce from 7894 (E) to fade in a long sideways phase in a loose range for 2-3 months, helping the currently overstretched Nifty to come down for a while before the next huge rally emerges.
Conclusion:
The Dow may have already started a corrective phase from the resistance of 21169 and may trace a long overdue sideways phase in the range of 20300-21500 (+/- 300). That would match nicely with the Nifty, which may also be entering a sideways phase between 8800-9300 (+/-200) for the next few months. This stable period could be followed by a year-end rally towards 22500 for Dow and 9900-10000 for Nifty.

Ranajay Banerjee
Leads the research team at KSHITIJ,COM. Has a deep understanding of Elliot Waves and a formidable memory of market history. Well known on Twitter as @ranajayb with a considerable fan following. Film scriptwriter by night.
Array
In our last report (03-Sep-25, UST10Yr 4.22%) we expected the FED cut rates by 50bp in the rest of 2025 and the shortend of the Curve to move down with the US2Yr falling towards …. Read More
The WTI Net Long/short position has remained below 2 for about 2-months now, the longest time since 2006. The market sentiment continues to be bearish on crude prices for the near term. … Read More
In our September 2025 outlook (15-Sep-25, EURUSD 1.1725), we expected Euro strength to be limited to 1.19/20, to be followed by a decline to 1.12 by Mar-26 and 1.0875 by Jun-26. We had expected a rise in the Euro after an expected …. Read More
In our 10-Sep-25 report (10Yr GOI 6.48%) we expected the RBI to be on pause in its next MPC meeting on 01-Oct. This is to be seen tomorrow. We had also said there was room for the FOMC to cut rates by 25-50bp, and accordingly they … Read More
In our 12-Sep-25 report (USDJPY 147.96), we expected the USDJPY to limit the downside to 144 and ascend towards 155-158 in the coming months. In line with our view, USDJPY limited the downside to … Read More
Our October ’25 Dollar Rupee Quarterly Forecast is now available. To order a PAID copy, please click here and take a trial of our service.
- Kshitij Consultancy Services
- Email: info@kshitij.com
- Ph: 00-91-33-24892010
- Mobile: +91 9073942877


