

Euro Long term Forecast - Apr'18
Apr, 18, 2018 By Saandhy Ganeriwala 0 comments


18-Apr 2018: Euro 1.236
RECAP
In our last report dated 01-Mar-18, we explored the possibility of Euro falling to 1.18-16 in April-June due to a possibly bullish Gold/WTI ratio and seemingly overbought Euro derivatives positions. At the same time, we had retained our earlier “more preferred” view of a straight rise past 1.25-26 towards 1.30-35. The Euro has meanwhile ranged between 1.215-1.247 in March and April.EXECUTIVE SUMMARY
Euro is likely to test long term resistance (1.25-26; possibly 1.28) in Apr/May. After that, we prefer a dip towards 1.20-1.17 by Sep/Nov. A breach of 1.26-1.28 immediately after May is less preferred. This is because:- The expected rise to 1.26-28 could mark the end of a 5 wave up move since Jan ’17.
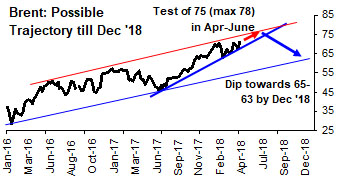
- Brent could rise to 75-78 by May ’18 and then fall to 65-63 by Dec ’18.
- Gold/Euro could bounce from support (1070) and a highly correlated Euro could simultaneously weaken.
 CORRECTION AFTER 1.26-1.28
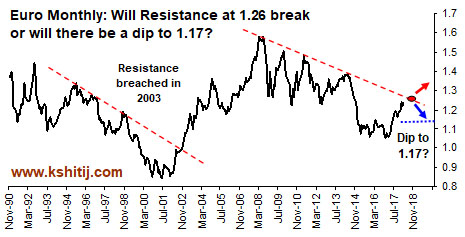
The adjacent long term chart presents the dilemma in question: There is striking similarity in pattern between the 2003 breach of long term resistance and the impending breach of long term resistance near 1.25-26 (possibly 1.28). The question is: Will this resistance be broken immediately (in Apr-May 2018) or, will there be a correction first?
Till now, we had preferred a straight break past 1.25-26, to target 1.30-35. However, mounting evidence suggests a dip towards 1.17 from 1.25-26 (possibly 1.28).
CORRECTION AFTER 1.26-1.28
The adjacent long term chart presents the dilemma in question: There is striking similarity in pattern between the 2003 breach of long term resistance and the impending breach of long term resistance near 1.25-26 (possibly 1.28). The question is: Will this resistance be broken immediately (in Apr-May 2018) or, will there be a correction first?
Till now, we had preferred a straight break past 1.25-26, to target 1.30-35. However, mounting evidence suggests a dip towards 1.17 from 1.25-26 (possibly 1.28).
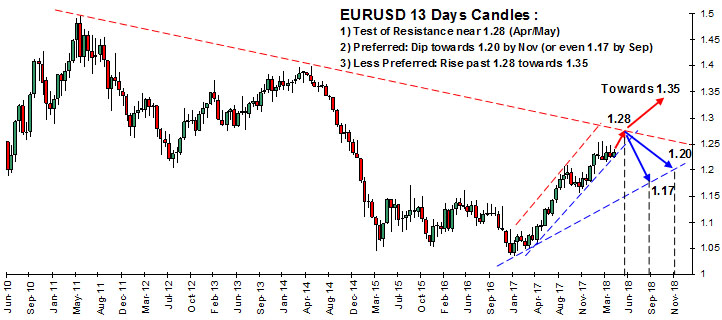 Since Jan ’17, Euro (1.236) has been rising in a 5 wave upmove and is currently in the last leg of the 5th wave. This last leg is likely to extend up till 1.25-26, but could also move further till 1.28, which is seen as resistance in the above 13 day candlesticks chart. After the end of the 5th wave near 1.25-26-28, a correction till 1.20-1.17 is possible (1.20 and 1.17 are obtained as the 23.6% and 38.2% retracements of the upmove since Jan ’17.) Moreover, a support trendline joining lows from Jan ’17 also yields 1.20-1.17 as a possible target zone on the downside.
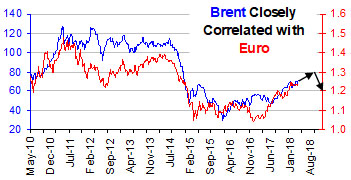
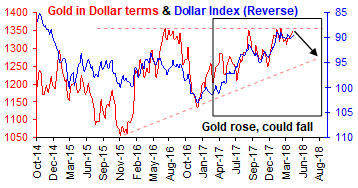
EURO TO TURN BEARISH WITH BRENT?
 |
 |
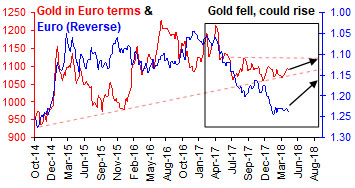
EURO COULD FALL AS GOLD/EURO RISES
 |
 |
CONCLUSION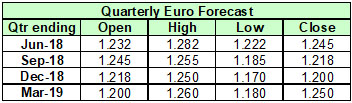
Euro is likely to test long term resistance (1.25-26-28) by Apr/May. After that, we prefer a dip towards 1.20-1.17 by Sep/Nov. A breach of 1.25-26-28 towards 1.30-35 immediately after May is less preferred. 
Saandhy Ganeriwala
Saandhy is a postgraduate in Economics, but like all good market-men, he seeks confirmation from technical analysis charts for his macroeconomic ideas. His research is a good mix of charts, stats and econ. Apart from that, he calls himself a news junkie and an occasional writer.
You may also like:


In our last report (27-Feb-26, UST10Yr 4.01%), which was published just one day before the start of the US-Israel-Iran War on 28-Feb, we had continued to target 4.60% on the US10Yr based on expectations of higher Crude. At that time, we were looking for Brent to rise …. Read More

The escalation of war between US and Iran throughout March-26 has led to a rally in Brent prices to as high as $119.50, exceeding our bullish targets by a large margin, much ahead of expected time. Will it remain bullish for the coming years?… Read More

Our view of a fall towards 1.14 seems to be playing out well so far as the tensions in the Middle East and the US-Iran conflict have triggered a rise in Dollar Index and crude oil prices, thereby weakening to Euro to 1.1507 so far in Mar-26. Will it again attempt to rise targeting 1.20? Or will it remain below 1.19/20 now and see an eventual decline to 1.10? …. Read More
In our 09-Mar-26 report (10Yr GOI 6.69%) we had warned that the sharp rise in crude due to the US-Iran conflict could push Brent toward $134, which would lift CPI toward ~6.2%, eliminating any chance of RBI easing, and potentially force tightening. This inflation shock, along with higher US yields, was expected to push the 10Yr GOI up to … Read More

In our 10-Dec-25 report (USDJPY 156.70), we expected the USDJPY to trade within 154-158 region till Jan’26 before eventually rising in the long run. In line with our view, the pair limited the downside to … Read More

Our March ’26 Dollar Rupee Monthly Forecast is now available. To order a PAID copy, please click here and take a trial of our service.