

Caution on Gold Bullishness
Jul, 27, 2019 By Vikram Murarka 0 comments


Slide 1
Hello, Dear Clients.
The general market sentiment is very bullish on Gold right now, with people looking for 2000$+ levels and Ray Dalio's article on Linked adding to the sentiment.
But, we want to share with you reason why Caution on Gold may be good.
Today is 26th July 2019, Gold is at $1418 and I am Vikram Murarka.
This video is a little long, but it might be worth your time. So, here goes...
Slide 2
True to its nature as a safe haven, the rise in Gold since May 2019 has been on the back of global tensions.
The left axis shows weakness in Yuan due to US-China trade wars. The right axis shows strength in Gold in the same period due to the US-China trade wars and US-Iran tensions.
It is said that the Chinese central bank has bought Gold in this period, but we would not lay too much store on that. I will show you why in the next slide.
Basically, the rise in Gold since May seems to be driven by news rather than value.
Slide 3
Let me show you the BIG picture in Gold, since 1836.
The upmove from $21 in the 1870-1930 period to $1921 in 2011 mave have completed a 5-wave sequence.
Wave 1 - Gold rose with WWI
Wave 2 - We take this period of stability as Wave 2
Wave 3 - started with the US breaking the Gold Standard in 1971 and ended with the Soviet invasion of Afghanistan in 1979-80.
Wave 4 - saw Gold come down to $272 in 2001, where the Bank of England famously sold its Gold reserves. That is why I am not very taken in by central bank action on Gold.
Wave 5 - saw Gold rising with the global commodity boom and Dollar weakness, culminating at 1921 in 2011.
Now we are possibly seeing a small A-B-C correction, where A has already happened. The current rally might be B and may end anywhere now, on this Moving Average resistance. A wave C (yet to happen) may bring the Log Chart down to 6.90, which would translate to $992 on Gold.
Slide 4
This is a very important chart, showing a very strong correlation between Gold and Crude since 1861.
And, regular clients know that we are bearish on Crude, targeting $33 by 2020-2021. Therefore, if the correlation holds, Gold too may come down towards $992.
Slide 5
Here is more medium term chart on Gold.
Here too, we see that the upmove since 1170 in Aug-18 may itself have been a 5-wave upmove, which might have got completed at $1454 in July.
Slide 6
Looking at a slightly bigger picture, we see that $1483 is the 50% Fibonacci retracement of the fall from $1920.70 to $1045.40. Also, we have a trendline Resistance at $1500 here.
So, there is a decent chance that Gold may either have topped out at 1454 itself, or might top out anywhere in the 1483-1500 region.
And now comes the really interesting part.
Slide 7
This chart shows the dramatic underperformance of Gold vis-a-vis the Dow Jones, clearly showing how Equities have been a better investment than Gold.
And, this underperformance is still very much in force. The Gold/ Dow ratio faces an important Resistance right here. If and while this holds, Gold can fall again.
Of course, the Resistance could break as well. But, then we would want to buy Gold only if we see clearly that the Resistance has broken. Not before.
Slide 8
Not only has Gold underperformed the Dow Jones, it has underperformed the Sensex as well.
And it faces a crucial Resistance right here, coming from 2007.
So, again, we cannot buy Gold unless this Resistance is broken.
Slide 9
Gold also faces Resistance against Copper right here. In fact, if the Gold-Copper ratio comes down, it might be good for Equities as well, as fear goes out of the market.
Slide 10
Gold has a good Resistance against Crude as well, and this is, in fact, a pretty strong Resistance.
Slide 11
And lastly, Gold is just coming off a Resistance right here on the MCX in India, one of the largest markets for Gold.
So, not only does Gold have Resistances on its own charts, it does not seem to be a value buy against 5 other markets.
This makes us very cautious about becoming bullish on Gold at current prices.
Slide 12
And, if the Resistances that we have pointed out hold, then Gold could come down towards $1360 or even $1300 by December.
Any positive news on the US-China trade front could be a positive trigger. On the other hand, fresh deterioration in the US-China or US-Iran situation could lead to the Resistances breaking. That said, the charts suggest greater chances of positive news and Gold coming down towards $1360-1300.
It may/ may not rise again from the $1360-1300 region. But, if the very long-term reading is correct, there may also be chances of seeing $992 by 2020-2021.
Let us see now that goes.
Slide 13
For now, those were the reasons why we think Gold does not glitter at current levels.
Thank you for your time.
For our regular high value research, please log on to https://kshitij.com/forecasts
Thank you again.

You may also like:


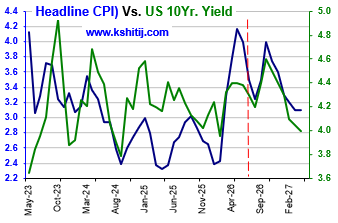
For the last few months we have been looking for Crude to rise towards $130-190 and pull up the US CPI towards 4.6% and the US10Yr Yield to 5.4% by Jan-27. This view has clearly gone wrong with Brent falling sharply below $90 as a result of the US-Iran peace deal, which is the …. Read More
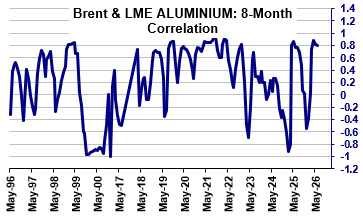
In our June 2026 report (1-Jun-26, Brent @ $95.47), we had expected Brent to correct to $88 before bouncing back to $120 and $145 by Aug-26 and Sep-26, respectively. A sustained trade below $90 was said to be incumbent on a fully credible resolution of the US-Iran war. … Read More
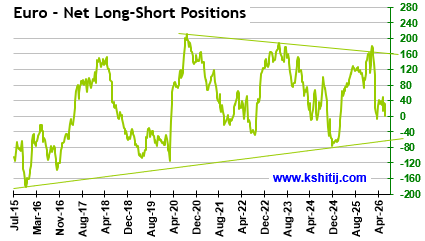
In our June 2026 report (10-Jun-26, EURUSD 1.1546), we expected the Euro to rise towards 1.17 in Jun-26 before reversing lower, with surging crude prices, rising inflation, and potential central bank rate hikes posing key risks amid the ongoing US-Iran conflict …. Read More
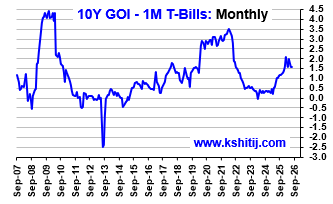
In our last report on 03-Jun-26 report (10Yr GOI 7.03%) we remained bullish on Brent and therefore called for higher CPI and higher Yields. At the same time, we said, “Our view will come under threat if Brent trades … Read More

In our 10-Dec-25 report (USDJPY 156.70), we expected the USDJPY to trade within 154-158 region till Jan’26 before eventually rising in the long run. In line with our view, the pair limited the downside to … Read More
Our July ’26 Dollar Rupee Quarterly Forecast is now available. To order a PAID copy, please click here and take a trial of our service.