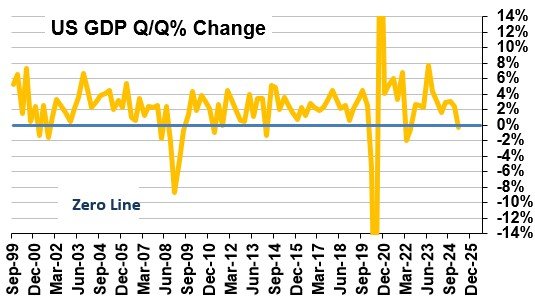
05-Aug-17
Yen 110.68/ JPYINR 0.5747/ US-Japan 10Yr yield spread 2.20%
Recap:
We had expected Dollar Yen to test 115-116 in July followed by a corrective dip towards 112-111 levels in our July’17 report.
Dollar-Yen came off from 114.50 to 110.55 in July contrary to our expectation of a further rise towards 115-116, mentioned in our Jul’17 report. The fall in Dollar Yen has been mainly because of an unexpected sharp fall in US Dollar Index below 96.
EXECUTIVE SUMMARY:
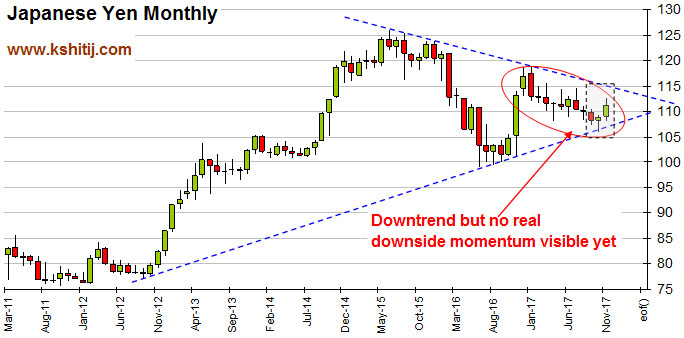
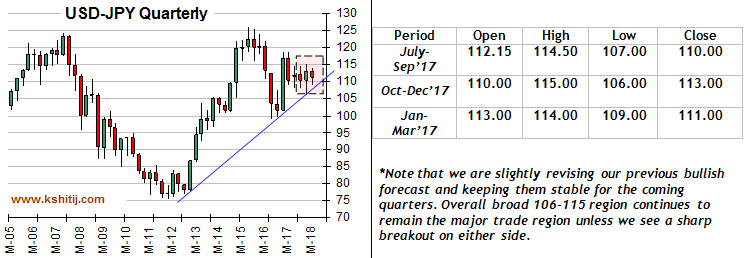
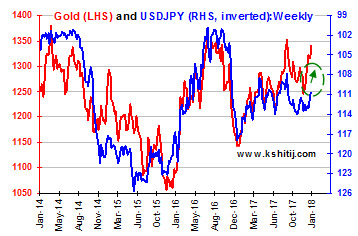
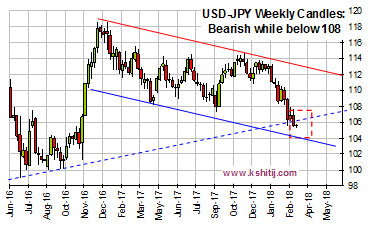
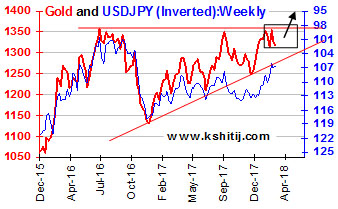
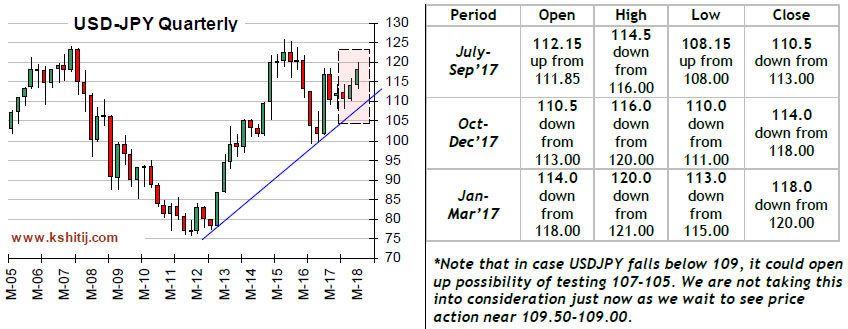
Dollar Yen has been trading near important levels just now. We are looking at two alternatives just now: either a break below 109.50 or a bounce back towards 113 from 109.50. A break below 109.50 could trigger a sharp fall towards 107-105 (we will take it into consideration on a confirmed break below 109.50/109.00). For now, the preferred view for Dollar Yen is on the upside.
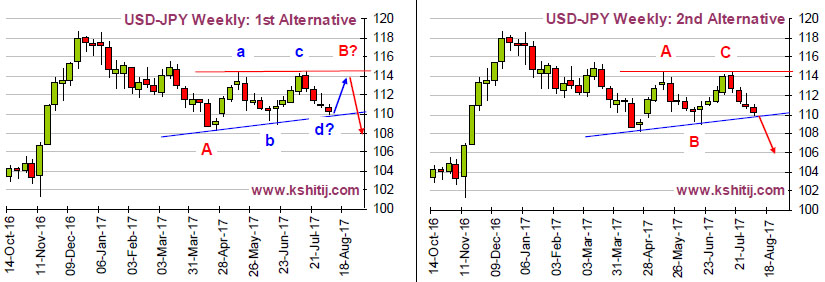
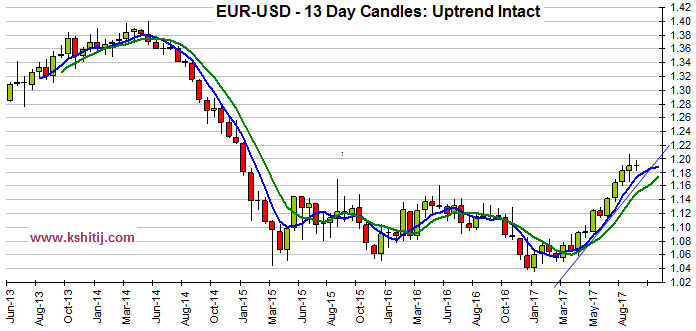
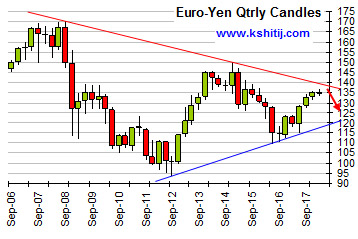
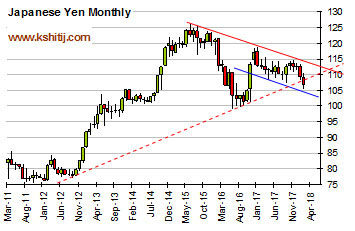
1st Alternative: The first chart on the left shows a possibility of an A-B-C correction where the current price action is in the B-leg and could bounce back towards 114 again before coming off to levels near 110-109 in the coming months.
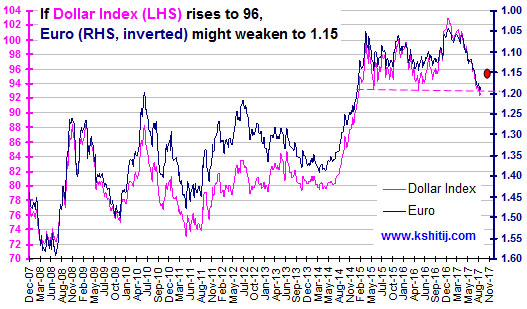
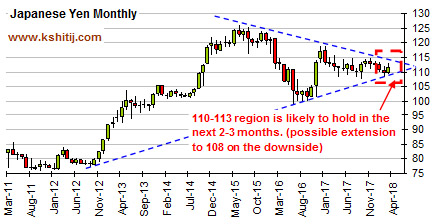
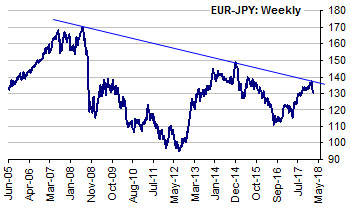
2nd Alternative: The chart on the right shows another possibility that the current fall may extend to levels below 110.00-109.50 to test lower levels of 107-108. In that case we may have to negate the immediate bounce back towards 112 or higher.
Overall the two possibilities shown above indicate that Dollar Yen is at a major inflection point just now having important support at 109.50. A break or bounce from this support will be the driver for further direction of Dollar Yen. While 109.50 holds, we stick to the 1st alternative; but considering the strong momentum of the fall from 114 levels, we cannot totally negate the possibility of the 2nd alternative playing out in the coming weeks.
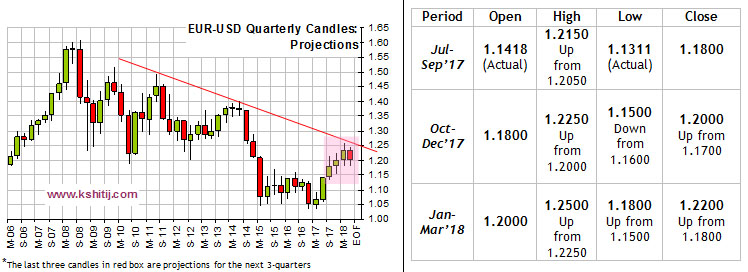
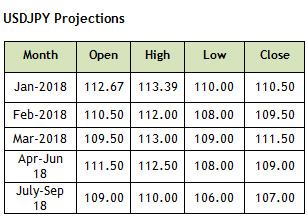
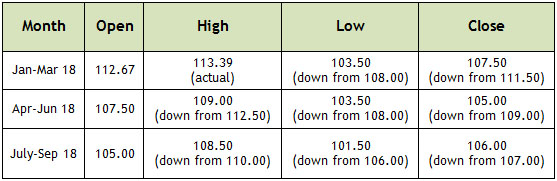
Quarterly Projections
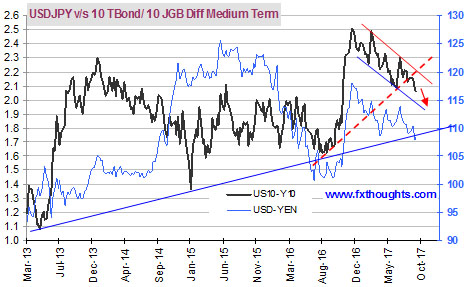
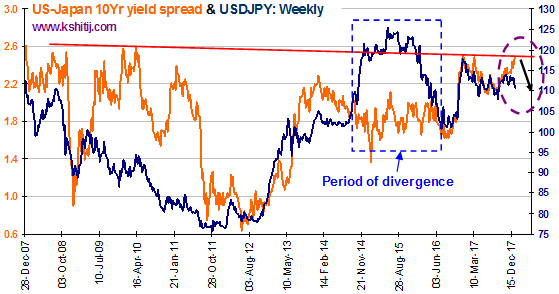
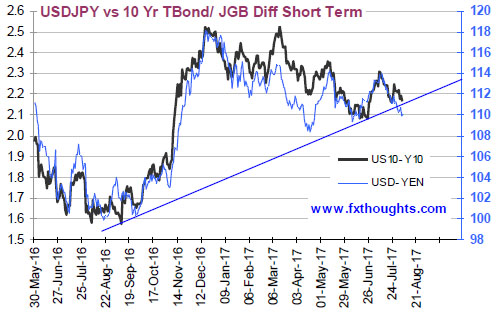 US-Japan 10Yr Yield Spread:
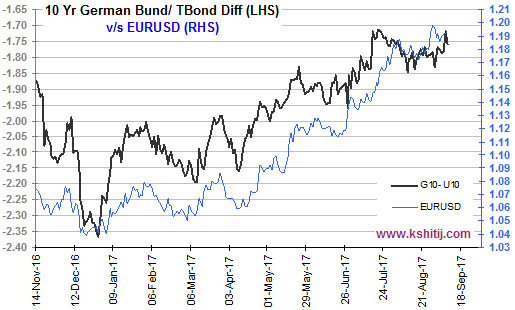
The US-Japan 10Yr Yield Spread (2.16%, LHS on chart alongside) has fallen from levels near
2.28% in July contrary to our expectation of a rally towards 2.33-2.35%%. The spread is currently just above immediate upport and while that holds, we may see a bounce back to 2.30% in August. Overall the yield spread is likely to remain stable in August, remaining within the broad 2.33-2.10% before possibly rising beyond 2.33% in the longer run.
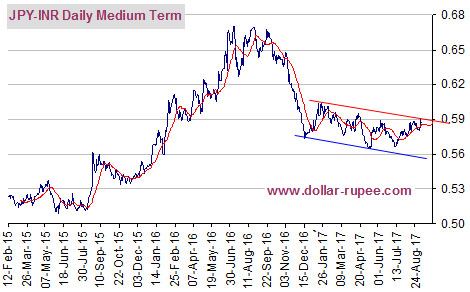
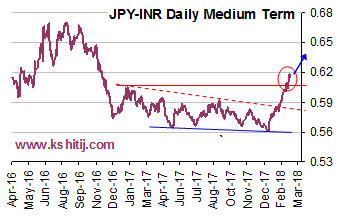
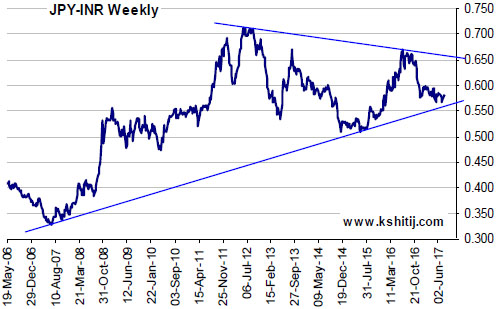 JPY/INR: To remain within 0.55-0.58
JPY/INR is trading near long term support at 0.55 and while that holds, the currency pair
looks potentially bullish for the coming weeks. A rise towards 0.60 is on the cards for the next couple of months. August could possibly see some stability in JPY/INR. The pair could test 0.55 on the downside before again coming back to current levels. Immediate resistance is visible near 0.58 which would not be very easy to break just now. JPY/INR could remain sideways for a
few more weeks before it attempts to break above 0.58.
Conclusion
Dollar Yen is trading at a crucial point. A bounce from 109.50 or break below would drive the next course of movement for the pair. While support at 109.50 holds, we prefer a bounce back towards 111-113 in August. Thereafter the currency pair could either remain stable for sometime or move up to test higher levels of 115-116 over September.
Note that in case the currency pair falls below 109, it could open up possibility of testing 107-105 for the medium term. We are not taking this into consideration just now as we wait to see price action near 109.50-109.00.