Author Archives: Saandhy Ganeriwala

About Saandhy Ganeriwala

Saandhy is a postgraduate in Economics, but like all good market-men, he seeks confirmation from technical analysis charts for his macroeconomic ideas. His research is a good mix of charts, stats and econ. Apart from that, he calls himself a news junkie and an occasional writer.

Brent Crude Weekly Candles Mar18

Crude Oil Report – Mar’18

26-Mar-18: Brent 70.36; WTI 65.64


Brent Crude Weekly Candles Mar18

  • Brent and WTI could dip to 67 and 62 while below previous highs at 71.28 and 66.56 Below that, even 62.5 (B) and 57 (W) could come into play.
  • However, if Crude rises past its previous highs, stronger resistances near 73 (B) and 68-69 (W) could be tested in Apr ’18, after which it could slowly move upwards towards 75-78 (B) and 70-72 (W) by Sep ’18. The target for Dec ’18 is revised upwards to 79 from 77 (B) and to 71.50 from 70.50 (W).


Download Report

Rupee REER and Nifty PE have fallen

Can Rupee REER fall with Nifty PE?

We asked the above question in Dec ’17. The chart of Rupee Real Effective Exchange Rate (REER) and Nifty PE evolved since then, as below:

Rupee REER and Nifty PE have peakedNifty PE had reached 26.6, which was near the peak last seen in the 2007 market top. Hence, we were unable to be bullish on Nifty PE any more. Moreover, the strong correlation between Rupee REER and Nifty PE (especially seen to be strong near peaks) meant that we were expecting Rupee REER (122.57 in Dec ’17) to be dragged lower with Nifty PE in 2018.

Rupee REER and Nifty PE have fallenOur view was proven correct. Nifty PE has seen a rather steep fall to 25.68 (Feb ’18) and 24.66 (Mar ’18). Along with it, Rupee REER has indeed been dragged lower from 122.57 in Dec ’17 to 119.51 in Feb ’18.


Rupee REER vs USDINRThe REER of Rupee tells us how much the market rate for Rupee deviates from its fair value. An REER value above 100 implies that the market rate is overvaluing the Rupee, while a value below 100 indicates undervaluation. Hence, a fall in REER implies that the Rupee’s overvaluation has decreased ie the Rupee has weakened. The green zones in the adjacent chart highlight the close correlation between Rupee REER and USDINR (inverse).

After a phase of divergence between 2014 and 2016*, the correlation has returned.

*This suggests that the Rupee did not weaken as much as it should have during 2014-16.


Indicative projections for REER NiftyPE and USDINRIn the adjacent table, we make indicative projections for REER, Nifty PE and USDINR on the basis of past examples, when steep falls in Nifty PE led to a drop in Rupee REER and a rise in USDINR. We project that if Nifty PE falls to 22 by Dec ’18, we could see USDINR rise to 67.


You can view our Economic Calendar with the current chart here.

EURUSD 13daycandles Apr18

Euro Long term Forecast – Apr’18

18-Apr 2018: Euro 1.236

RECAP

In our last report dated 01-Mar-18, we explored the possibility of Euro falling to 1.18-16 in April-June due to a possibly bullish Gold/WTI ratio and seemingly overbought Euro derivatives positions. At the same time, we had retained our earlier “more preferred” view of a straight rise past 1.25-26 towards 1.30-35. The Euro has meanwhile ranged between 1.215-1.247 in March and April.


EXECUTIVE SUMMARY

Euro is likely to test long term resistance (1.25-26; possibly 1.28) in Apr/May. After that, we prefer a dip towards 1.20-1.17 by Sep/Nov. A breach of 1.26-1.28 immediately after May is less preferred. This is because:     

  • The expected rise to 1.26-28 could mark the end of a 5 wave up move since Jan ’17.
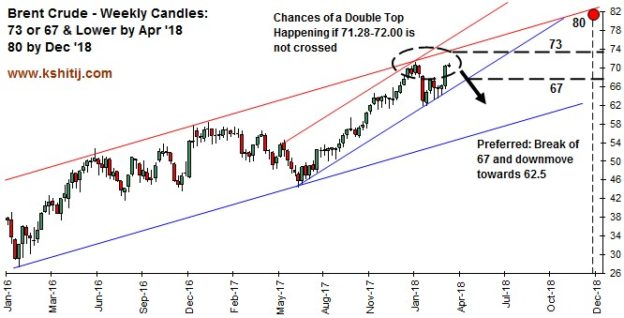
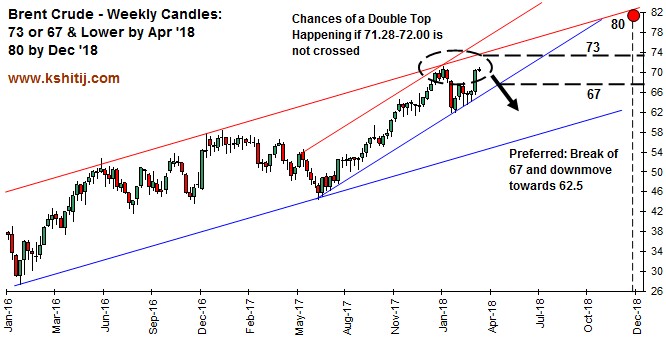
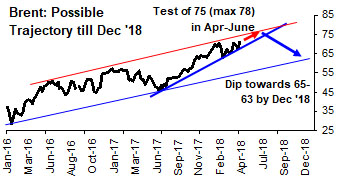
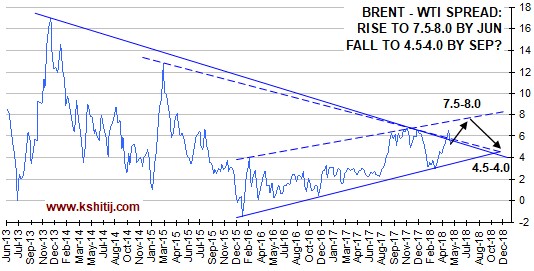
  • Brent could rise to 75-78 by May ’18 and then fall to 65-63 by Dec ’18.
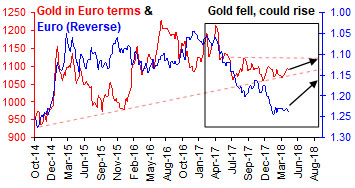
  • Gold/Euro could bounce from support (1070) and a highly correlated Euro could simultaneously weaken.

We are effectively changing our earlier preference of a straight rise past 1.26, to a dip from 1.26-28.


EUR Monthly Apr18CORRECTION AFTER 1.26-1.28

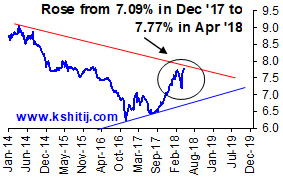
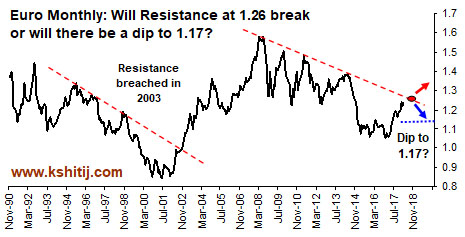
The adjacent long term chart presents the dilemma in question: There is striking similarity in pattern between the 2003 breach of long term resistance and the impending breach of long term resistance near 1.25-26 (possibly 1.28). The question is: Will this resistance be broken immediately (in Apr-May 2018) or, will there be a correction first?

Till now, we had preferred a straight break past 1.25-26, to target 1.30-35. However, mounting evidence suggests a dip towards 1.17 from 1.25-26 (possibly 1.28).


EURUSD 13daycandles Apr18

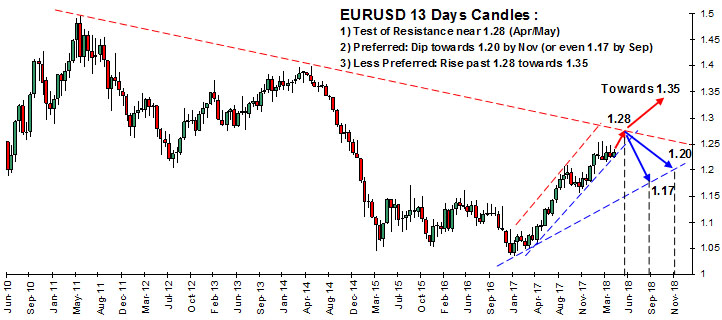
Since Jan ’17, Euro (1.236) has been rising in a 5 wave upmove and is currently in the last leg of the 5th wave. This last leg is likely to extend up till 1.25-26, but could also move further till 1.28, which is seen as resistance in the above 13 day candlesticks chart. After the end of the 5th wave near 1.25-26-28, a correction till 1.20-1.17 is possible (1.20 and 1.17 are obtained as the 23.6% and 38.2% retracements of the upmove since Jan ’17.) Moreover, a support trendline joining lows from Jan ’17 also yields 1.20-1.17 as a possible target zone on the downside.


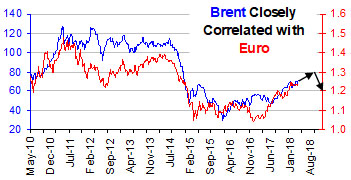
EURO TO TURN BEARISH WITH BRENT?

Brent corelated with EURO BRENT possible trajectory

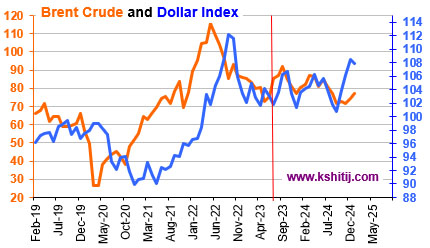
Euro has historically seen close positive correlation with Crude. In our Mar ’18 Crude forecast, our preference was for Brent (72.1) to break support at 67 and move lower towards 62 in Apr-Jun, followed by a rally in the second half of the year towards 77-80. However, the support has held, with Brent already seeing highs near 73. We believe it could stay bullish till 75-78 in Apr-Jun, and then, Jul-Sep could see it take a bearish turn towards 65-63. This syncs with our projection of near term bullishness in Euro, followed by bearishness from June onwards.


EURO COULD FALL AS GOLD/EURO RISES

Gold in EURO terms and EURO reverse Gold in Dollar terms and Dollarindex reverse

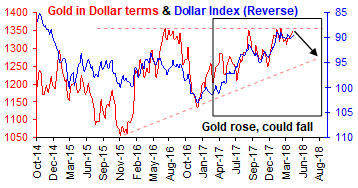
Above, we see inverse correlation between Euro and Gold/Euro. Gold/Euro (1091) has fallen from 1212 in Apr ’17. It is currently bouncing from long term support near 1070 and could target 1130-1150, causing the Euro to weaken towards 1.17 (possibly even 1.15). Similarly, resistance on Gold (in terms of Dollar; currently 1348) near 1350-1370 could push it down towards 1300-1275 and the Dollar Index could strengthen towards 93-95, which is the same as saying that the Euro could weaken. The boxes in both graphs indicate a divergence in trend since Apr ’17 for Gold/Euro (downwards) and Gold in Dollar terms (upward). It would be reasonable to expect some convergence of trends to happen in the months ahead, which thereby implies Euro weakness.


CONCLUSIONEURO Quarterly projections table Apr18

Euro is likely to test long term resistance (1.25-26-28) by Apr/May. After that, we prefer a dip towards 1.20-1.17 by Sep/Nov. A breach of 1.25-26-28 towards 1.30-35 immediately after May is less preferred.

Brent WTI spread May18

Crude Oil Report – May18

7-May-18: Brent 75.41; WTI 70.32


Brent WTI spread May18 In the backdrop of Brent and WTI both achieving new highs, we explore when our predicted bearish turn could happen. For the first time, we explore EIA’s Demand-Supply balance forecasts and also introduce a new Data View Section containing Production, Demand and Inventory data. Our projections for Dec ’18 are significantly revised.

Download Report


25% Discount

FILL SURVEY FOR 25% DISCOUNT

The KSHITIJ Monthly Crude Report will become chargeable from next month onwards.

We are offering a 25% discount on your first subscription.

To claim the 25% discount, fill up the below 1-minute survey. We will get in touch with you soon.

25percent discount

Indian 10 year yields

Can the GOI rise to 8% in 2018, and then, 9% in 2019?

We asked the above question in Dec ’17, when the 10yr GOI yield was 7.09% and featured the below chart for the month of May in our 2018 Economic Calendar.

Indian 10 year yieldsThe GOI yield has indeed risen, to 7.77%, within kissing distance of 8%.

The US and German 10 Year yields have also risen from 2.38% and 0.31% towards 2.96% and 0.54% respectively. The global bond selloff was largely due to the rally in Brent to 75.5, plus a pick-up in growth and inflation expectations in US and Europe.

GOI 10 year yieldThe GOI 10 Year yield rose also due to the initial fiscal deficit target (17-18) of 3.2% not being met. An interim attempt to control the Govt’s borrowing costs might be underway: through an increase in FPI investment limits for short-dated debt and through more Open Market Operations by the RBI this year.

However, with US yields likely to test 3.25% in the medium term, the 10Yr GOI yield should test 8% later this year. Beyond that, in case the US 10Yr happens to break above 3.25% also, then the 10Yr GOI might also rise towards 9.00% in the long-term, perhaps in 2019. For that, we might need Brent to break above $80 and target $90.

SBI lending rate vs repo rate vs 10yr GOI yieldCAN LENDING RATES RISE?

Movement in the 10Yr GOI is often mirrored in a similar move (after a lag) in the RBI’s Repo rate and in the SBI’s Lending Rate, as seen alongside.

With the RBI MPC members remaining hawkish, it is possible to see a Repo rate hike in the June RBI meeting. Also, since the MCLR is very responsive to the Repo rate, there could be a danger of lending rates also rising by 0.25-0.50%.