Born Again Sensex Bulls
Jan, 20, 2006 By Vikram Murarka 0 comments

Happy New Year !
Gentle Reader, this issue comes out after a considerable gap (so what's new?) and you could say we've been lazy. We would say we've been busy making money for Clients, but still, this issue of "The Colour of Money" has been long pending. Thank you for bearing with us. We start with something new this year by looking at the Indian equity market, reserving a case study in Foreign Exchange trading for the next issue. Happy Reading!
Born Again Sensex Bulls
The Sensex has risen 233% in less than 3 years (from near 2908 in Apr-03 to 9689 in Jan-06), yielding an average return of 77% per annum. Many people on the Street are fearful and some are more or less convinced that this exponential rise may be a bubble, waiting to burst.
Perhaps not. Vertigo is understandable if you use a zoom lense and look at the steep rise in last 3 years. However, we used a very wide angle lense to look at the Sensex over a span of 27 years since its inception and think there is room for "born again Sensex Bulls". The basis for our bullishness is that the Sensex has started moving up after a 10-year consolidation, that it represents a wider cross section of the economy than before and that the economy itself has moved onto a higher growth path.
Decade Long Consolidation
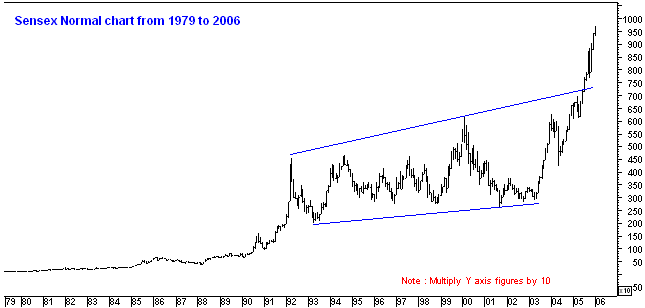
After its inception at 100 in 1979 the Sensex "apparently" moved sideways till the mid-80s (more on that a little lower down). It gained speed and started moving up rapidly from 1987-88 and reached a zenith near 4550, culminating with the Harshad Mehta scam in April 1992. Thereafter, the Sensex went into a decade long consolidation between 2100 (1993 bottom) and 6150 (2000 top). It has now exploded out of the channel, suggesting that there may be a multi year Bull Run in the offing.
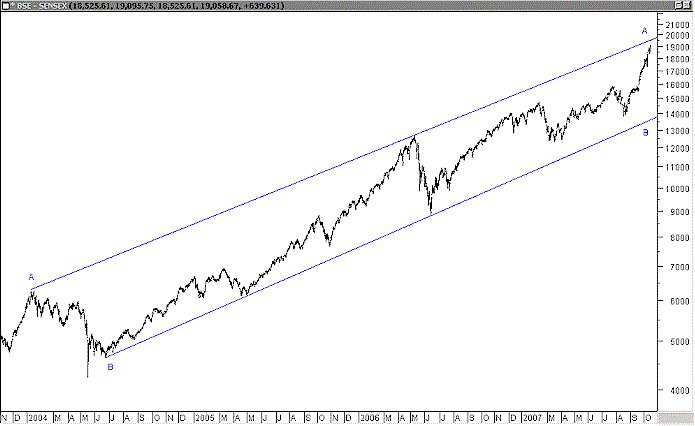
In fact, the Sensex again offers the same opportunities for creating tremendous wealth like it provided in the period from 1979 to 1992. This fact is not captured in the normal monthly chart as seen above. For that, we look at the Log Chart (below), which tracks percentage price movements as opposed to a normal chart, which tracks absolute price movements. For example a move from 100 to 200 to 300 will be shown as 100 point move each time in a Normal chart. A Log chart, on the other hand, will show the move from 100 to 200 as a 100% move and from 200 to 300 as a 50% move.
From 1979 till 1992, the market was in a very big bull run producing a stupendous return of 3581%. Subsequently, in the next decade the market consolidated within an upward slanting channel (AA and BB) as Corporate India came to terms with the realities of reforms, deregulation and liberalization and companies worked frantically to restructure themselves. The period was also marked by several government changes and the emergence of coalition governments as a new political reality for India. The corporate sector lived through all this and became leaner, meaner and ready to take on the world.
Slowly the world realized that India meant business. As global capital embarked on a diversification drive in the aftermath of 9/11 (a process that may continue for several more years), India rode the wave of a new Emerging Markets euphoria. In June 2005 the Sensex broke through the upper end of its decade long run of "merely adequate" returns.
It now seems that the decade long consolidation may be over and the Sensex may soar once again for several years like it did in the period from 1979 to 1992. Compared with the 3581% rise at that time, the Sensex has risen "only" 300% so far from the April 2003. There would still be a lot of room on the upside, if history is to repeat itself, and the current bull run may, in fact, be in its infancy.
NEW and IMPROVED
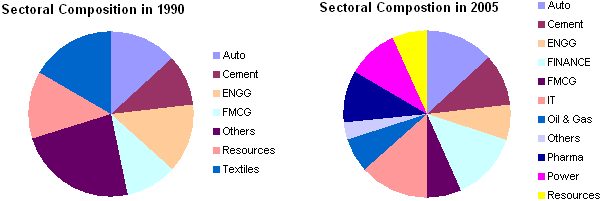
The Indian economy has changed in the last 10 years while the Sensex was slumbering like Rip Van Winkle. Reflecting the changed structure of the Indian economy, the composition of the Sensex has also changed.
In 1990 the index was limited in its composition and had only a few sectors participating in it. The Index composition is much more diverse today incorporating almost all the sectors of the economy apart from agriculture. Notable additions are IT and Oil & Gas while Textiles is the notable deletion. It's a whole new improved Sensex that we are buying today.
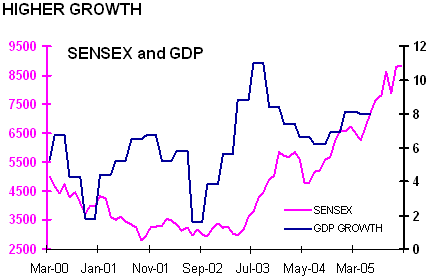
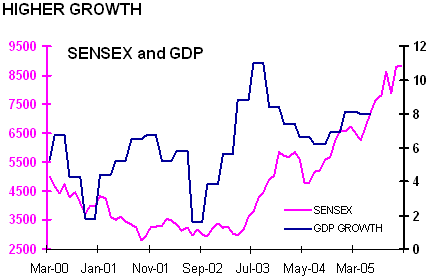 Lastly, there has been a sharp increase in GDP growth after Sep-02. The economy has moved into a new, higher growth zone altogether, as can be seen in the chart alongside. The Sensex also has moved up sharply in the same period, reflecting the new found growth.
Looking at the Sensex from three different perspectives, viz. its percentage movement (the Log chart), its composition change (the Pie chart) and its rooting in strong GDP growth (the Line chart) we would tend to believe that a structural bull run similar to that of the 80's may have just started.
Array
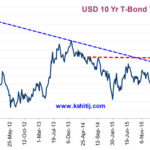
In our last report (29-Dec-25, UST10Yr 4.12%) we had said the US2Yr could fall to 3.00%. However, contrary to our expectation, the US2Yr has moved up. The US10Yr has also risen, much earlier than …. Read More
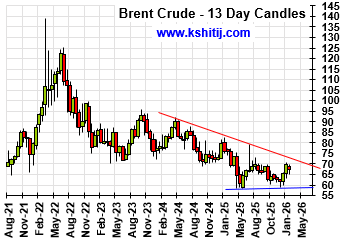
Having risen sharply in Jan-26 to $70.58, will Brent again rise past $70 and continue to rise in the coming months? Or is the rise over and the price can move back towards $60? … Read More
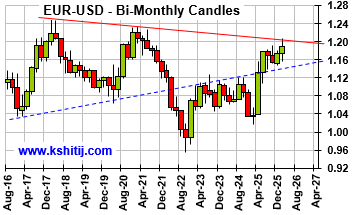
Euro unexpectedly reached 1.2083 in Jan-26 on Dollar sell-off but recovered quickly back to lower levels. Will it again attempt to rise targeting 1.24? Or will it remain below 1.20/21 now and see an eventual decline to 1.10/08? …. Read More
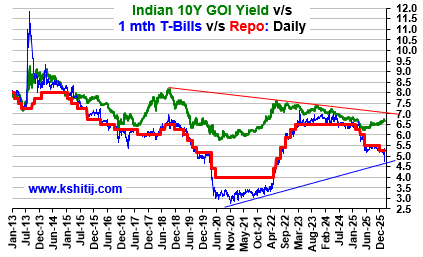
The 10Yr GOI (6.6472%) had risen to a high of 6.78% on 01-Feb. It has dipped a bit from there but has good Support at … Read More
In our 10-Dec-25 report (USDJPY 156.70), we expected the USDJPY to trade within 154-158 region till Jan’26 before eventually rising in the long run. In line with our view, the pair limited the downside to … Read More
Our February ’26 Dollar Rupee Monthly Forecast is now available. To order a PAID copy, please click here and take a trial of our service.
- Kshitij Consultancy Services
- Email: info@kshitij.com
- Ph: 00-91-33-24892010
- Mobile: +91 9073942877


