

A Review - Born Again Sensex Bulls. (Jan-06)
Oct, 15, 2007 By Vikram Murarka 0 comments

Recap
22 moons ago, on 20-Jan-2006 , when the Sensex was 9311, we had said that “..although the Sensex has risen 300% since April-2003, there could still be a lot of room on the upside, if history is to repeat itself, and the current Bull Run may, in fact, be in its infancy”. For those who missed that report, it is available at http://colourofmoney.kshitij.com/born-again-sensex-bulls/
The market has risen another 100% since then, even after the terrible May-June 2006 fall, and the Sensex has closed above 19000 today. We thought it would be appropriate to take a fresh look at the charts.
Where to now?
The “Sub-Prime” crisis in the US a couple of months ago had brought the world to the brink of, possibly, the worst financial disaster since 1929. But, then Super-Fed came to the rescue. Underscoring the overriding influence of the US Federal Reserve on the markets, almost all financial markets bottomed on 17-Aug, the day the Fed cut its Discount rate by 50 bps to 5.75%. The Sensex too bottomed on the same day, after hitting a low of 13779.88. The rally gained further wings after the Fed cut the Fed Funds rate, again by 50 bps, to 4.75%, on 18-Sep . The Sensex has rallied 21.62% in 18 sessions since then.
Please take a look at the daily Log Chart below. The Sensex is seen to have been moving up inside an upward sloping channel marked AA and BB, connecting the peaks at 6249.60 (Jan-04) and 12671.11 (May-06). It is now close to the upper end of this channel, with Resistance near 19800–20000 . Given the sharp upmove in the last few days, and the importance of the Resistance, it is time to be cautious and book partial profits on 16-22 month old Long positions. Although we don't want to become outright bearish given the massive inflows into Emerging Markets, the charts ask us to be prepared for 16000-15000, a 15-20% correction.
What could trigger a correction? We don't know. But, the answer could, perhaps, once again lie with the US Fed , which is scheduled to meet on 31-Oct. At the moment, our view is that Fed will not cut rates unless the global stock markets “misbehave”. But, a “no further rate cut” by the Fed could take the wind out of the markets' sail triggering a correction. Or it could be the soaring Crude prices.
Either way, this Deepawali, it might pay to have some cash in the bank.


You may also like:

In our last report (29-Apr-26, UST10Yr 4.35%), we had said that the FED was likely to leave rates unchanged, which it did. We had also said that “once Kevin Warsh comes in, the FED is more likely to cut, responding to …. Read More
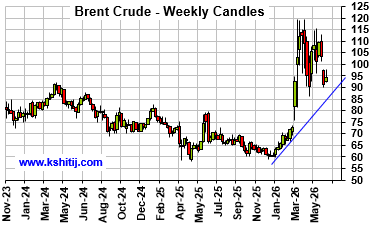
In our May 2026 report (4-May-26, Brent @ $110.75), we expected Brent to test $90.50 by Jul-26, followed by a rise to $145.13 by Sep-26 and $161.93 by Dec-26. Sustained trade below $100 was expected to be seen only on a credible resolution of the US-Iran war, which looked unlikely … Read More
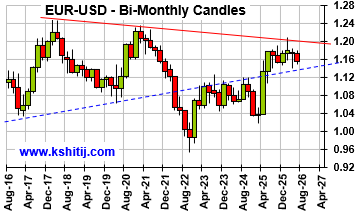
In our May 2026 report (11-May-26, EURUSD 1.1762), we expected the Euro to rise to 1.1950 by May-26 before falling towards 1.16-1.14 in the coming months. We delayed the fall to 1.10 from the earlier expected Aug-26 to Mar-27 as the Dollar Index remained within a broad range for more than expected …. Read More

In our 11-Apr-26 report (10Yr GOI 7.03%) we had retained our bullish view on Brent towards $134 by Sep-26, while allowing for a near term dip to $95 on hopes of a US-Iran resolution. Brent fell to $89.93, lower than … Read More

In our 10-Dec-25 report (USDJPY 156.70), we expected the USDJPY to trade within 154-158 region till Jan’26 before eventually rising in the long run. In line with our view, the pair limited the downside to … Read More
Our June ’26 Dollar Rupee Monthly Forecast is now available. To order a PAID copy, please click here and take a trial of our service.