Global Equities: Time for Caution
Jul, 10, 2017 By Ranajay Banerjee 0 comments

10-July-17
World 1913/ Dollex 3982/ Nikkei 19929/ Nifty 9666/ Sensex 31364
RECAP
In the report of Jun’17, we expected fatigue in Dow near 21600-800, established a long term target of 10800 for Nifty with a pinch of salt in the near term as Nifty valuation seemed close to bubble zone. Shanghai target was set at 3300 and Kospi was expected to appreciate by 10%. As it turns out, Dow has not been able to rise above 21600 so far and Nifty shows early signs of correction in the near term. Shanghai has hit a high of 3193 and Kospi has added 1.5% to its recent gains.
EXECUTIVE SUMMARY
Our latest studies tell us that caution is warranted for the next 3-4 months. Sensex/Nifty outperformance relative to BRIC and the World may be tempered. The Indian markets should be treated cautiously till Oc’17 when Nifty may find a major bottom and resume the larger uptrend for the target of 10800.
World: Time for caution?
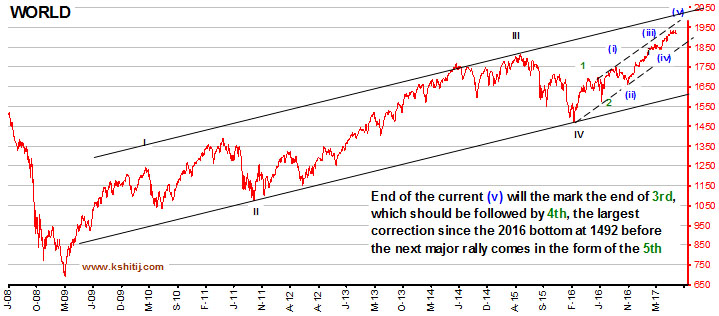
The chart above shows the MSCI World Index faces immediate resistance near 1950 within long term target of 2015-50 (+4-6%). If and while the Resistance at 1950 holds, we might see a decline of 7% to around 1815. From there, the next rise towards 2050 would still be pending.
Sensex outperformance facing resistance
 |
 |
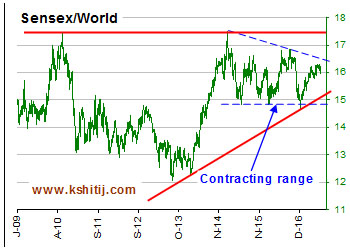
The charts above show the continued outperformance of Sensex compared to the BRIC countries and the World but Sensex/BRIC needs a break above 112 and Sensex/World needs a break above 16.5 for continuation of uptrend.
Dollex 30: Time for consolidation?
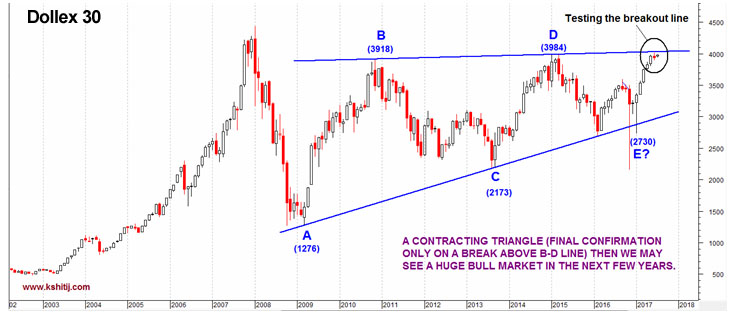
One of the major reasons behind our bullishness regarding Nifty is this long term bullish Triangle formation in Dollex 30. Currently the price is testing exactly the final resistance/breakout line but the highly overbought state warrants a breather in the form of a consolidation or a correction. Rest for a quarter would be very healthy for the technical structure and the following rise may be much stronger and sustainable.
Nifty: Target of 10800 may take more time
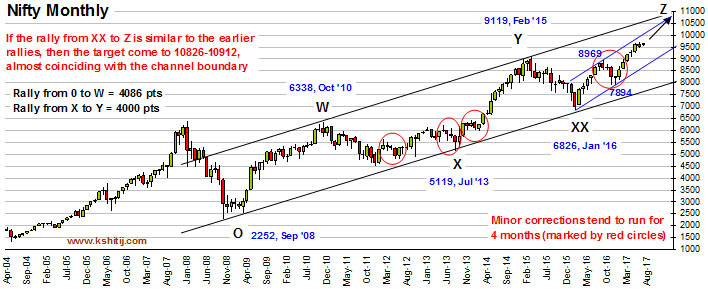
We have been following this long term chart of Nifty which shows the entire rally from the 2008 bottom of 2252 to the current high of 9700 clearly divided into 3 major rallies interrupted by 2 corrective phases. The first part of the current rally from 6826 (black XX) to 8969 took 6 months before a 4-month correction set in. The second part of the rally from 7894 to the life high of 9710 has taken 6 months too and a near to medium term correction may be likely now.
As marked on the chart by red circles, corrections in the uptrend have tended to be 4-month long. If that time pattern is repeated, then the expected correction may run till Oct’17 before the larger uptrend resumes. In that case, our long term target of 10800 may not be met by Sep’17 but by our secondary time target of Mar’18 (both discussed in Jun’17 report).
Nikkei: Will risk-appetite decline for a quarter?
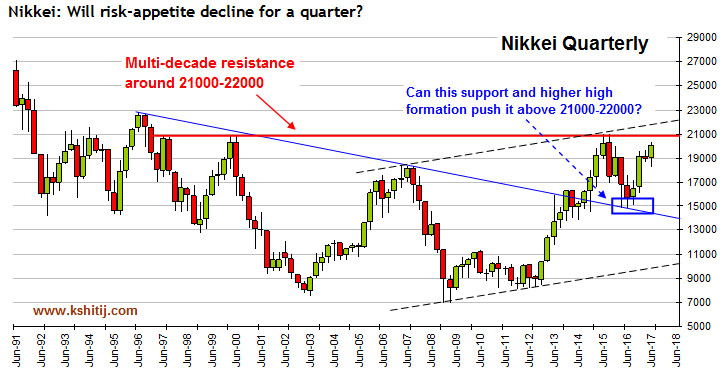
Yen is treated as a global safe haven and an indicator of the risk appetite. Generally Yen weakens and Nikkei rises with increasing risk appetite and vice versa. The long term chart of Nikkei above shows a major resistance near 21000 (about 4% away from the current levels). If Nikkei fails to rise above the major resistance band of 21000-22000 in the coming days, then the risk appetite may dip but the technical formation indicates eventual breakout above 21000-22000 but probably not on the very first attempt. Once again, this chart suggests caution for the next 1-3 months.
CONCLUSION
The major trend remains up for most of the global markets but caution is warranted for the next 3-4 months. While World may appreciate by another 4-6%, it would be prudent to anticipate consolidation/correction which may begin even from the current levels. Any correction in the global markets would affect the Indian markets too but Sensex/Nifty may outperform and be damaged less. A corrective state till Oc’17 is a probable scenario when Nifty may find a major bottom and resume the larger uptrend.

Ranajay Banerjee
Leads the research team at KSHITIJ,COM. Has a deep understanding of Elliot Waves and a formidable memory of market history. Well known on Twitter as @ranajayb with a considerable fan following. Film scriptwriter by night.
Array
You may also like:

Global Equities: Time for a breather?
17, Apr 2017
Global Equities: Powering to the upside
16, May 2017-

Global Equities: Where should you put your money?
9, Jun 2017 
Global Equities: Something for both Bulls and Bears
4, Aug 2017
Global Equities: Chinese Stocks to outperform USA and India
6, Sep 2017
Global Equities: Why we are unable to buy
26, Oct 2017
In our last report (29-Dec-25, UST10Yr 4.12%) we had said the US2Yr could fall to 3.00%. However, contrary to our expectation, the US2Yr has moved up. The US10Yr has also risen, much earlier than …. Read More
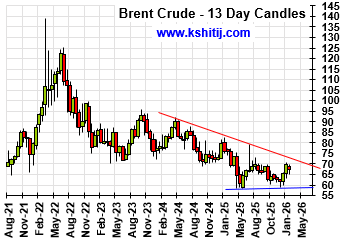
Having risen sharply in Jan-26 to $70.58, will Brent again rise past $70 and continue to rise in the coming months? Or is the rise over and the price can move back towards $60? … Read More
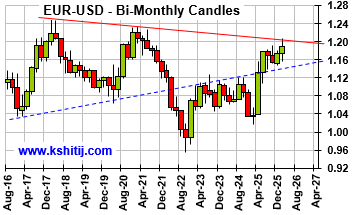
Euro unexpectedly reached 1.2083 in Jan-26 on Dollar sell-off but recovered quickly back to lower levels. Will it again attempt to rise targeting 1.24? Or will it remain below 1.20/21 now and see an eventual decline to 1.10/08? …. Read More
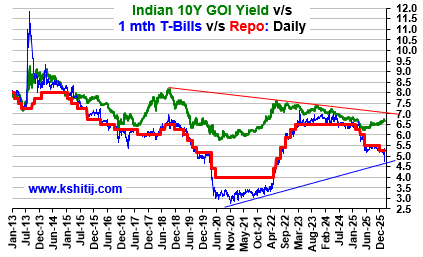
The 10Yr GOI (6.6472%) had risen to a high of 6.78% on 01-Feb. It has dipped a bit from there but has good Support at … Read More
In our 10-Dec-25 report (USDJPY 156.70), we expected the USDJPY to trade within 154-158 region till Jan’26 before eventually rising in the long run. In line with our view, the pair limited the downside to … Read More
Our February ’26 Dollar Rupee Monthly Forecast is now available. To order a PAID copy, please click here and take a trial of our service.
- Kshitij Consultancy Services
- Email: info@kshitij.com
- Ph: 00-91-33-24892010
- Mobile: +91 9073942877


