

Classic Double Top Chart Pattern
Jul, 02, 2005 By Vikram Murarka 0 comments

Series on Chart Patterns
Classic Double Top
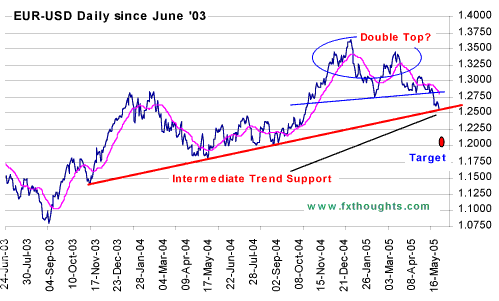
It is not often that the market present a copybook example of a classic chart pattern in real life. The Euro-US Dollar traced a classic Double Top recently. We present here an article we wrote for the "Technical Analysis of Stocks and Commodities" magazine on 23-May-05 when the EUR-USD rate was 1.2585
Back in Jan-05 (please refer to "The Colour of Money" issue dated 12-Jan-05) the Elliot Wave counts on EUR-USD since 2002 and the 10 Yr Bund-Bond Yield Differentials together indicated that the Euro would fall.
The promise of the Jan-05 outlook had worked out correctly. Towards the end of May-05, the charts presented a compellingly bearish EUR-USD picture. There was a
- Completion of a 5-Wave uptrend from Oct-00
- Break of Trend Support coming up from Apr-02
- Double Top created since Nov-04 with Tops registered in Dec-04 and Mar-05.
- A Negative Crossover on the 200-day Moving Average
Not all at once
Even though the charts were bearish, the Euro was not falling further. One of the most intriguing facets of the market (as of life) is that even when technical targets are clearly known and set, they do not materialise immediately. The targets take time to come by. As Einstein said of Time, "The only reason for time (to exist) is so that everything doesn't happen at once."
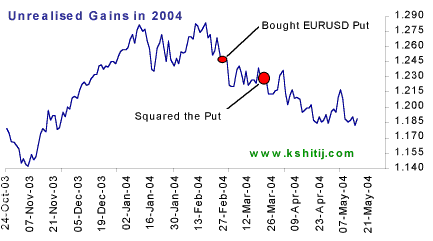
 It takes time for the market to reach where it has to because it needs to overcome obstacles on the way, such as the one in shown in the chart alongside.
Although the big uptrend since 2002 had been broken, there was an intermediate Trend Support coming up from Nov-03. It provided Support just above 1.2500. This had to break for the target of 1.20 to be achieved.
The question was, could there be a small bounce to 1.27 before the trendline broke, in a case of "Reversal to Double Top Neckline" (the blue line in the chart above)? Or would there be a clean break of the intermediate Trend Support (the Red line)?
French Vote as catalyst
As it turns out, the French "No" vote to the Euro constitution, followed by the Dutch "No" in June proved to be a bearish catalyst, enabling the EUR-USD to break cleanly through the intermediate trend support shown above. As the market reacted negatively to the news, the Euro fell to eventually fulfill the 1.20 target suggested by the classic Double Top shown above.
A very satisfying Double Top and yet another shining example of how Fundamentals align themselves to prove the Charts correct!

You may also like:
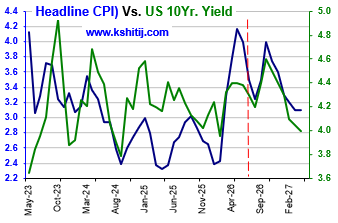
For the last few months we have been looking for Crude to rise towards $130-190 and pull up the US CPI towards 4.6% and the US10Yr Yield to 5.4% by Jan-27. This view has clearly gone wrong with Brent falling sharply below $90 as a result of the US-Iran peace deal, which is the …. Read More
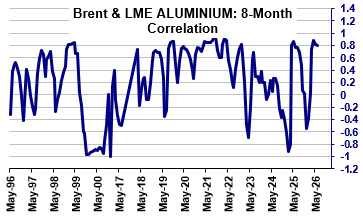
In our June 2026 report (1-Jun-26, Brent @ $95.47), we had expected Brent to correct to $88 before bouncing back to $120 and $145 by Aug-26 and Sep-26, respectively. A sustained trade below $90 was said to be incumbent on a fully credible resolution of the US-Iran war. … Read More
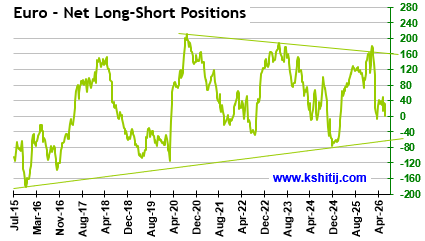
In our June 2026 report (10-Jun-26, EURUSD 1.1546), we expected the Euro to rise towards 1.17 in Jun-26 before reversing lower, with surging crude prices, rising inflation, and potential central bank rate hikes posing key risks amid the ongoing US-Iran conflict …. Read More
In our last report on 03-Jun-26 report (10Yr GOI 7.03%) we remained bullish on Brent and therefore called for higher CPI and higher Yields. At the same time, we said, “Our view will come under threat if Brent trades … Read More

In our 10-Dec-25 report (USDJPY 156.70), we expected the USDJPY to trade within 154-158 region till Jan’26 before eventually rising in the long run. In line with our view, the pair limited the downside to … Read More

Our July ’26 Dollar Rupee Quarterly Forecast is now available. To order a PAID copy, please click here and take a trial of our service.