
The Shoulder Head Shoulder chart pattern
Aug, 25, 2004 By Vikram Murarka 0 comments

A common mistake
The Shoulder-Head-Shoulder is one of the most popular Reversal patterns in classical charting as it is visually appealing and promises handsome gains if read correctly. Sometimes, Chartists tend to make a common mistake in reading it though, as illustrated below:
 |
 |
The fault lay not in the chart pattern, but in the initial reading. A very important point to remember about SHS is that the profit objective from the Neckline is roughly equal to the distance between the Head and the Neckline. As such the previous trend should have been of a sufficiently long duration to accommodate the profit objective. Further, since the SHS is a Trend Reversal pattern (not a Trend Correction pattern), there should ideally be further room available (beyond the profit objective) for the new trend to perpetuate. These conditions were not met in this case of a "false" SHS.
 The Charts aren't perfect, though
Of course, It does happen sometimes, that even a Classical SHS, meeting the conditions mentioned, does not deliver to its full potential, as seen alongside. The GBPUSD had developed a pronounced Bear SHS in Q1-04, with an ideal Profit Objective near 1.7150. Unfortunately, the low seen was only 1.7480 on 14-May-04, well short of the target.
Since Charting is not an exact science, the only way to deal with this would have been to employ a Trailing Stop Loss to protect Short positions. This is the realm of skilful Trading, an ability acquired with effort and experience.

Array
You may also like:
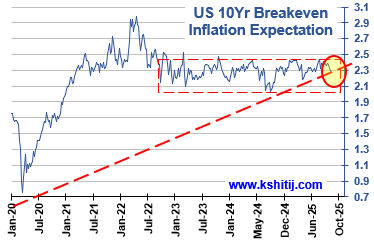
In our last report (09-Oct-25, UST10Yr 4.11%) we continued to expect the FED to cut rates by 25bp-50bp in its 29-Oct and 10-Dec meetings and for the US10Yr to dip to …. Read More
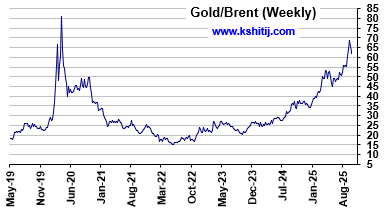
With sharp decline in Gold and Gold/Brent ratio, will Brent now start moving higher? Or will other geopolitical and global issues continue to weigh and put pressure for a lower crude price?… Read More
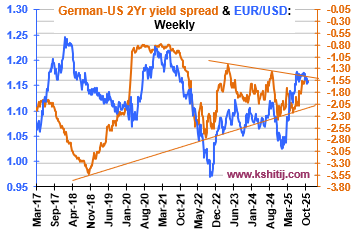
The German-US 2yr yield has been hovering just below crucial resistance. Will it decline sharply from here and suggest Euro weakness? Or can it break higher in the coming months? …. Read More

In our 30-Sep-25 report (10Yr GOI 6.57%) we expected Inflation to rise strongly, but the CPI has surprised by falling to 1.54% instead, the lowest level since 2017. The US FED has cut the Fed Rate by … Read More
In our 08-Oct-25 report (USDJPY 152.68), we expected the USDJPY to initially rise to 154-155 in the near term followed by a fall to 149.50 in Nov-25 before … Read More
Our November ’25 Dollar Rupee Monthly Forecast is now available. To order a PAID copy, please click here and take a trial of our service.