
Insight: Pessimistic GDP forecasts could be a bullish sign
Aug, 05, 2016 By C S Vijayalakshmi 2 comments

05-August-16 Real World GDP 2015: 3.1% / Current Global GDP consensus: 3.04% (2016)
EXECUTIVE SUMMARY
It is to be reasonably expected that initial forecasts of global GDP forecasts may be off the mark by a relatively wide margin. However, contrary to what might also be reasonably expected, the forecasts do not tend to get much better with subsequent revisions. Still, tracking the changes in the forecasts over time might give us useful insights into global economic sentiments.
This surmise is based on our study of the changes in averages of global GDP forecasts by various agencies for 2015 and 2016 from January 2015 to July 2016.
Comparing 2015 Actual GDP with 2015 & 2016 Consensus Projections
The study below how the 2015 GDP consensus forecast turned from optimism to pessimism.
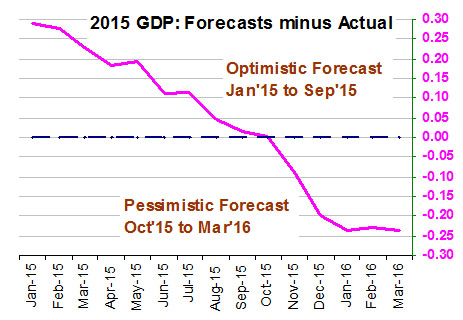
The chart beside tracks the difference between the forecasts for 2015 GDP since Jan-2015 and the actual 2015 GDP that later came out at 3.1%.
It shows that the initial forecasts were 0.29% higher than the subsequent actual. The difference kept reducing over time and actually went down to -0.25% by January 2016.
The positive difference over the period Jan-15 to Sep-15 is marked in the chart as “Optimistic Forecast” and the negative difference from Oct-15 to Mar-16 is marked as “Pessimistic Forecast”.
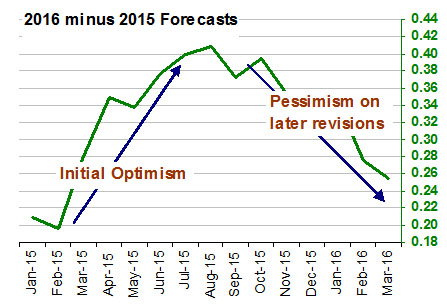
This chart tracks the changes in the difference between GDP forecasts for 2016 and 2015 since Jan-2015.
Initial forecasts suggested that 2016 growth would exceed 2015 growth by 0.20%. This difference grew to 0.41% by Aug-2015. This period is marked as “Initial Optimism”.
Later, as the 2015 forecasts were revised downward, the 2016 forecasts were also revised downwards such that the 2016-2015 difference came down to 0.26% by Mar-2016. This second period is labeled as “Pessimism on later revisions”.
The fact that the “Forecasts minus Actual GDP” difference swung from a large positive to a large negative in the first chart (instead of stabilizing near zero) supports our surmise that initial forecasts did not improve with subsequent revisions. But, what explains the swing itself? Why did the nature of forecasts change from optimistic to pessimistic?
Presumably the sharp fall in commodity prices and in the Chinese stock market from April-May 2015 compelled a lot of forecasters to downgrade their projections for Chinese growth and to become gloomy about global growth prospects as well. Further, we see that this gloominess impacted not only the forecasts for 2015, but also the forecasts for 2016, as seen in the second chart. This leads to our second surmise that whether or not the GDP forecasts can be useful in estimating actual GDP, the changes in the GDP forecasts can be used as an indicator for getting a handle on global economic sentiments.
In the next section we present the background of our study and look at the sentiment aspect a little deeper.
Initial forecasts had an optimistic bias earlier. Might be a little pessimistic now.

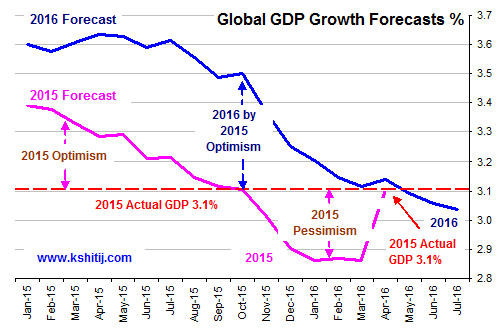
Here we track the consensus global growth forecasts for 2015 and 2016 from Jan-2015 to Jul-2016 and also the actual 2015 GDP published by IMF at 3.1% in April 2016.
Note that the forecasts for both years were revised lower over time. The period from Jan-2015 to Sep-2015 is marked as “2015 Optimism” as the 2015 GDP forecast in this period was higher than the actual. This later turned into pessimism by Jan-2016.
The higher projections for 2016 over 2015 till Sep-2015 are marked as “2016 by 2015 Optimism”. This too has turned into pessimism now as the 2016 forecast is now lower than the 2015 actual.
Forecasts depend on market sentiments
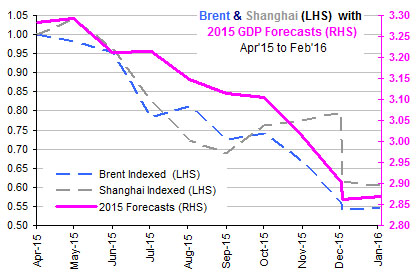
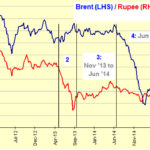
Most of the cuts in the 2015 GDP forecasts were seen between July-December 2015, during which period Crude prices and the Chinese equity markets also saw sharp declines, as tracked in this chart.
This raises the suspicion that downward revisions in GDP forecasts were more a reflection of sentiments in the global commodity and equity markets, rather than estimates of real economic growth.
Going back up to the chart on the top of this page, we see that the 2016 consensus forecast (3.04%) has been cut further since mid-2016, and now stand lower than the 2015 actual of 3.10%. The post Brexit sentiment is reflected in the June revisions and possibly indicate bullish signal for 2016.
CONCLUSION
The markets seem to have priced in all negative news, including Brexit, and no positive news is visible currently. If some positive surprises kick in the latter half of 2016, the actual GDP figures could come out better than the forecasts, exactly as it happened in 2015.
Early indications of positive surprises are the better NFP (non-farm payroll) data in the USA for June and July and the increase in July PMI (purchasing managers’ index) figures worldwide. Is further growth improvement in the offing?
If we use the GDP forecasts less for their intended purpose of estimating GDP and more as indicators of global macroeconomic sentiment, we are inclined to take a contrarion stance and be more optimistic about economic growth than the consensus. This study bolsters our overall bullishness on global commodity and equity markets.
In conclusion, we give an overview of the data sources and the methodology of this study.
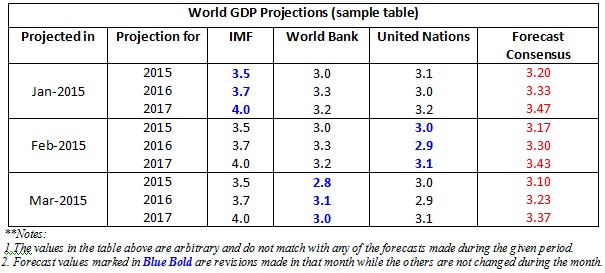
Data Sources: The consensus forecast used in the above charts are the average of forecasts taken from 29 major institutions (including respective governments and central banks, IMF, OECD and World Bank) that publish forecast reports at different time intervals during a year. Majority of the projections are seen in the months of April-July and Oct-Dec. Forecasts made earlier is kept constant until any revisions are made.
Methodology: Projections by different institutions like IMF, World Bank, Central Banks, S&P, Goldman Sachs etc are tracked and revisions are updated every month for the current and the upcoming years. The average of forecasts made for a particular year in a particular month is tabulated as below. Note that the figures in the table are arbitrary examples taken to reflect the trend in the actual projections:
Note: In a bullish context, you might also want to read our April 2016 study, wherein we have forecasted a possible 9X increase in the US Dow Jones Index over the next 10-15 years.

C S Vijayalakshmi
Vijayalakshmi has the rare ability to look at charts using both Classical charting as well as Elliot Waves, which she combines with excellent proficiency in Excel. A growing presence in the social media sphere, she is also an accomplished danseuse and choreographer.
Array
You may also like:

In our last report (23-Feb-24, US10Yr @ 4.25%), we had laid out our near term view (that the ongoing rise in the US10Yr may/ may not extend up to 4.5%), our medium term view (that the US10Yr can still fall to 3.5%) and our long term view of a rise towards 5.0% and higher going into 2025. …. Read More
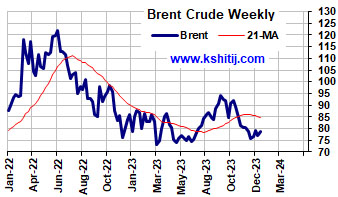
After breaking above the earlier range of $70-85, Brent has moved up higher. Will it sustain and break above $90? Or will it fall back to $80/70? … Read More
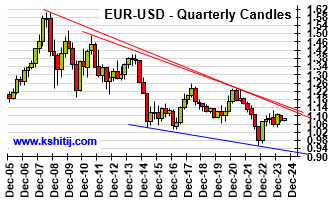
Euro could not move above 1.0981 in March and has been trading well below 1.10 post the surprise rate cut by SNB last month. Will Euro continue to trade below 1.10? Or can it remain stable for a while and show a sharp breakout above 1.10? ……. Read More

Our April ’24 Quarterly Dollar-Rupee Forecast is now available. To order a PAID copy, please click here and take a trial of our service.
Our March ’24 Monthly Dollar-Rupee Forecast is now available. To order a PAID copy, please click here and take a trial of our service.