

Global Equities: Something for both Bulls and Bears
Aug, 04, 2017 By Ranajay Banerjee 0 comments

4-August-17 Dow 22026/ Sensex 32325
RECAP
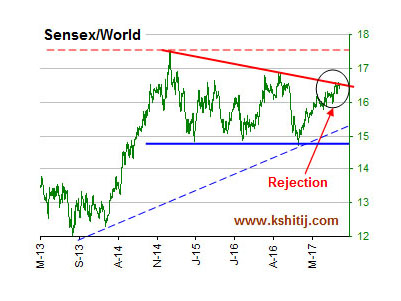
In the report of Jul’17, we talked about caution for 3-4 months and expected relative underperformance of Sensex against BRIC and World. It was suggested that the Indian market be treated with caution till Oct’17. Despite the expected underperformance against other indices, Sensex itself has gained over 4% since our Jul’17 report.EXECUTIVE SUMMARY
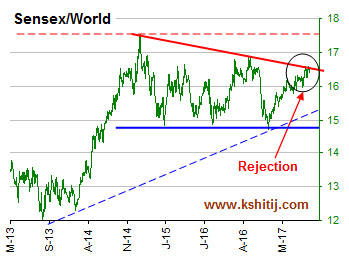
The expected correction in the global markets has not materialized yet but the time for caution is also not past yet. At the same time, while we are cautious, some bullish factors (like weakening Gold/Copper ratio, and other emerging markets attracting strong inflows) are cropping up which may support increasing risk-appetite not only at the current high levels but even higher. Sensex underperformance relative to BRIC and World may continue.DOW: FACING MAJOR RESISTANCE
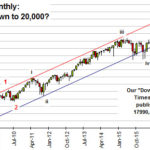
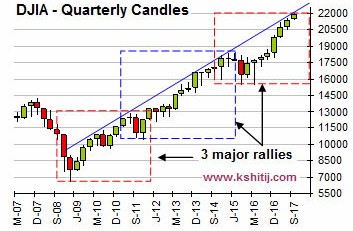 The rise of Dow from the 2009 low of 6470 to current high of 21681 can be divided into 3 major rallies. The current rally (upper red box) achieves equality with the first rally (lower red box) at 21813, only 0.6% higher from the current high of 21681. This projection equality coupled with the long term trendline resistance near 22100 makes 21800-22100 a formidable resistance and a place to be cautious.
SENSEX: TIME FOR CAUTION
 A similar combination of long term trendline resistance and equality projection can be seen in Sensex above. The current rally from 25754 (black box) achieves equality with the earlier rally from 22495 to 29077 (blue box) at 32300. The trendline resistance comes slightly higher at 32850-900. Therefore unless Sensex rises above 32900, downside risks cannot be negated completely and caution is recommended.
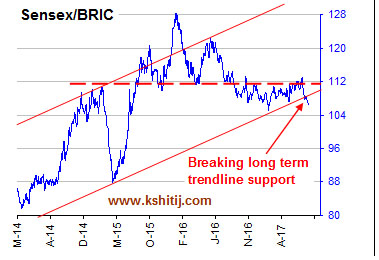
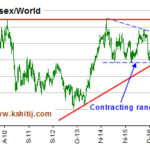
SENSEX MAY UNDERPERFORM BRIC AND WORLD
 |
 |
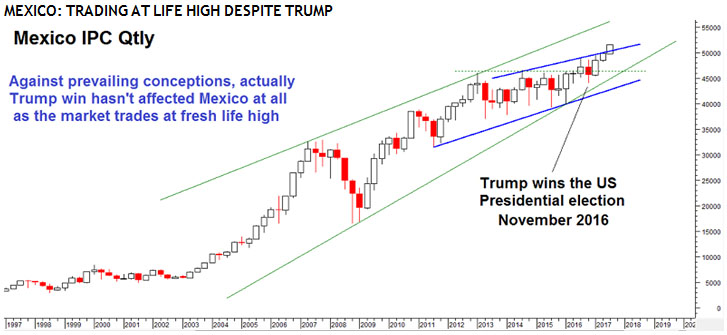 The Emerging markets markets are seeing a lot of inflow and even a country like Mexico, which stands in a direct conflict with the President Trump of the USA (its most important neighbor and trading partner), is seeing major gains. As seen above, the Trump Presidency has failed to negatively impact Mexican equities. Contrarily, it seems to have been beneficial for Mexican equities.
TURKEY: BREAKOUT FROM MULTI-YEAR TRIANGLE CONSOLIDATION
 Turkey is another country where the global perception about its economy has failed. The country has been in a phase of intense political disturbance in the last few months but it seems that the turmoil has actually helped the equity market to end its multi-year consolidation and resume the long term uptrend in a very sharp manner.
2016 saw a failed coup by a faction of the army, terrorist attacks and the Turkish Lira coming under intense pressure but a large government stimulus has helped the GDP to recover from -1.8% (Dec’16) to +5% (Mar’17) and boosted equities. Despite the fear of it turning to be a “gray rhino”, the index may rise another 10% in the coming quarters.
Turkey is another country where the global perception about its economy has failed. The country has been in a phase of intense political disturbance in the last few months but it seems that the turmoil has actually helped the equity market to end its multi-year consolidation and resume the long term uptrend in a very sharp manner.
2016 saw a failed coup by a faction of the army, terrorist attacks and the Turkish Lira coming under intense pressure but a large government stimulus has helped the GDP to recover from -1.8% (Dec’16) to +5% (Mar’17) and boosted equities. Despite the fear of it turning to be a “gray rhino”, the index may rise another 10% in the coming quarters.
SHANGHAI: PERSISTENT UPTREND
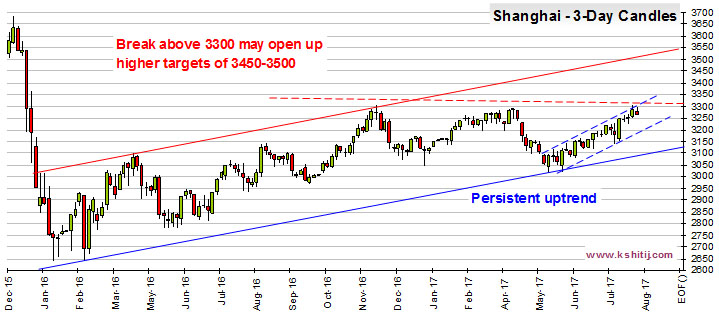 Despite all the worries about the Chinese economy, the Shanghai Index trades near a 19-month high. As long as the support at 3150 holds, the trend remains firmly up and a break above 3300 may open up 3450-3500, appreciation of another 4.5-6.0%. If China remains strong, the risk scenario could improve further.
We examine below two fundamental factors that are encouraging for global growth as a whole.
Despite all the worries about the Chinese economy, the Shanghai Index trades near a 19-month high. As long as the support at 3150 holds, the trend remains firmly up and a break above 3300 may open up 3450-3500, appreciation of another 4.5-6.0%. If China remains strong, the risk scenario could improve further.
We examine below two fundamental factors that are encouraging for global growth as a whole.
CHINA: RECOVERING FROM SLOWDOWN?
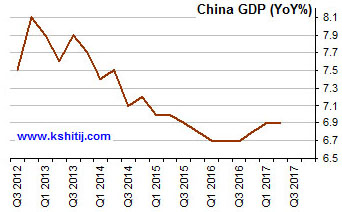 The world spent 2016 fearing a “hard landing” in China as the authorities tried to transition from an investment led economy to a consumption led economy.
However, as the chart above shows, growth seems to be picking up again in 2017 after a continuous decline since 2012. The Q2FY 2017 GDP came at 6.9% (yoy), better than the expected 6.8%. The Q3 and Q4 consensus forecasts stand at 6.7% and 6.6% currently, and could be revised upwards in the coming weeks, given that the Chinese PMI has seen a sharp pickup to 51.1 in July, compared to 50.4 and 49.6 in the earlier months.
The world spent 2016 fearing a “hard landing” in China as the authorities tried to transition from an investment led economy to a consumption led economy.
However, as the chart above shows, growth seems to be picking up again in 2017 after a continuous decline since 2012. The Q2FY 2017 GDP came at 6.9% (yoy), better than the expected 6.8%. The Q3 and Q4 consensus forecasts stand at 6.7% and 6.6% currently, and could be revised upwards in the coming weeks, given that the Chinese PMI has seen a sharp pickup to 51.1 in July, compared to 50.4 and 49.6 in the earlier months.
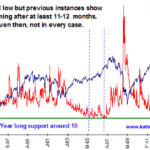
GOLD-COPPER RATIO: FRESH RISK-ON?
 This chart shows that the Gold-Copper ratio (currently 439) is standing at a very important inflection point. A weekly close below the long-term channel support at 430 opens up much lower levels of 380-60, signaling increasing global risk appetite and stronger belief in the stability of the world economy.
Why does this matter? When the Gold-Copper ratio comes down, it implies more demand for Copper relative to Gold. This usually happens when either (a) there is lesser demand for Gold as a “safe haven” or (b) there is more industrial demand for Copper, or both. In either case, a decline in the Gold-Copper ratio is generally interpreted as a symptom of increase in global growth rates.
This chart shows that the Gold-Copper ratio (currently 439) is standing at a very important inflection point. A weekly close below the long-term channel support at 430 opens up much lower levels of 380-60, signaling increasing global risk appetite and stronger belief in the stability of the world economy.
Why does this matter? When the Gold-Copper ratio comes down, it implies more demand for Copper relative to Gold. This usually happens when either (a) there is lesser demand for Gold as a “safe haven” or (b) there is more industrial demand for Copper, or both. In either case, a decline in the Gold-Copper ratio is generally interpreted as a symptom of increase in global growth rates.
FOLLOW-UP ON KOSPI: TIME TO BE CAUTIOUS
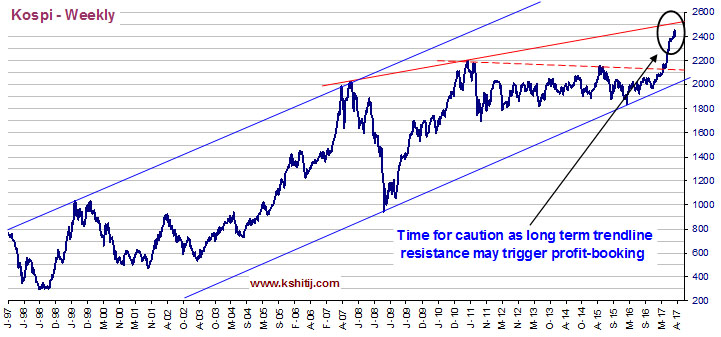 This is a follow-up on the South Korean Kospi, which was last discussed in our Jun’17 report. It was written that the index may rise to 2500-2600 soon and in line with our expectations, the index has indeed hit a high of 2453 in July with 2500 in touching distance now. We had also discussed the possibility of a consolidation near 2500 and the time for that consolidation phase looks near and the long term bulls may take some profit away from the table.
Keeping with our previous view, we may see a multi-month consolidation if the index fails to rise above 2500 but the long term uptrend may resume for 2600 and higher in the months following the correction.
This is a follow-up on the South Korean Kospi, which was last discussed in our Jun’17 report. It was written that the index may rise to 2500-2600 soon and in line with our expectations, the index has indeed hit a high of 2453 in July with 2500 in touching distance now. We had also discussed the possibility of a consolidation near 2500 and the time for that consolidation phase looks near and the long term bulls may take some profit away from the table.
Keeping with our previous view, we may see a multi-month consolidation if the index fails to rise above 2500 but the long term uptrend may resume for 2600 and higher in the months following the correction.
CONCLUSION
Despite the US and Indian markets running the risk of severe correction in the near term, we must allow for the possibility of further upside before the expected correction materializes. The continued inflow into even unlikely emerging markets like Mexico and Turkey and the rally in industrial metals relative to safe havens like Gold point to still increasing risk appetite which may push the indices higher.
Ranajay Banerjee
Leads the research team at KSHITIJ,COM. Has a deep understanding of Elliot Waves and a formidable memory of market history. Well known on Twitter as @ranajayb with a considerable fan following. Film scriptwriter by night.
You may also like:


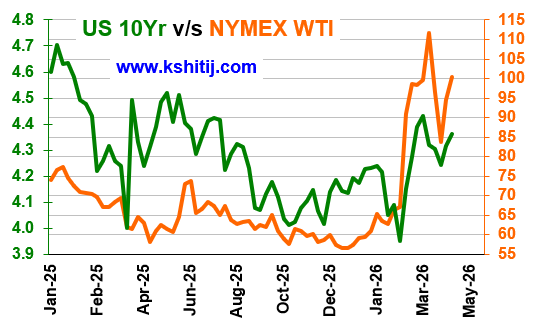
In our last report (28-Mar-26, UST10Yr 4.43%), we had assumed little chances of the USA being able to easily extricate itself from the US-Israel-Iran war, and we said that as long Brent remains above $80, we can look for a sharper rise in the US10Yr towards …. Read More
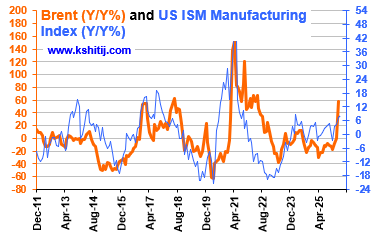
In our April 2026 edition (7-Apr-26, Brent @ $111.48), we expected Brent to test $89.26 by Jun-26 followed by a rise to $145.13 by Sep-26 before consolidating between the two levels for the rest of the year. As expected, Brent did see a corrective dip to… Read More
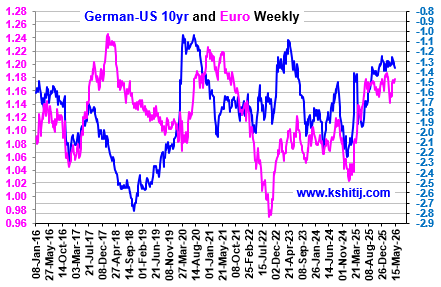
In our April 2026 report (13-Apr-26, EURUSD 1.1686), we expected the Euro to rise to 1.1950 by May-26 while retaining our long-term bearishness towards 1.10 by Aug’26. The main reasons were good chances of a rise in the Dollar Index and crude prices. The markets expect the ECB to move. …. Read More
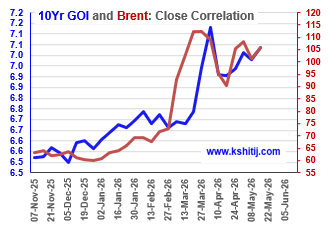
In our 07-Apr-26 report (10Yr GOI 7.05%) we had assigned a 65-70% probability to Crude rising towards $145 by Sep-26 and had said that this could cause the CPI to move up to 6.2% by Nov-26 and the 10Yr GOI to target 7.37% by Feb-27. Since then, Brent has seen two short-lived dips below $100 but has … Read More

In our 10-Dec-25 report (USDJPY 156.70), we expected the USDJPY to trade within 154-158 region till Jan’26 before eventually rising in the long run. In line with our view, the pair limited the downside to … Read More
Our May ’26 Dollar Rupee Monthly Forecast is now available. To order a PAID copy, please click here and take a trial of our service.